K20 LEARN
Transpiring Trees: Plant Transpiration and the Water Cycle
Looking for a tree-rific addition to your water cycle unit? Teams of young foresters examine the role of transpiration in the water cycle through a week's worth of activities. Pupils analyze how trees take in and transport water during...
Curated OER
Bar Graphs and Survey Questions- Internet Access
In this graphing and data collection activity, students examine a bar chart that show data collected from 1998 - 2006 that shows the percentage of households that have Internet access. They answer questions based on the chart and make...
Odyssey of the Mind
Odyssey of the Mind Curriculum Activity: HEALTHY HUMOR
This lesson is hilarious! To understand how to investigate a topic, collect data, and evaluate the results, learners research the effects of laughter on health. Each group is assigned a research task, which they will turn into...
Anti-Defamation League
The Gender Wage Gap
"Equal pay for equal work!" may sound logical but it is not the reality. High schoolers begin a study of the gender wage gap with an activity that asks them to position themselves along a line that indicates whether they strongly agree...
Curated OER
Slanted Surveys And Statistics
Learners engage in a lesson that is concerned with the use of statistics and surveys and how they should be read. They create a survey and take it home to collect data. Then students display the data on a graph that is displayed in class.
Curated OER
Gathering Statistics for Research
Students gather statistics to include in their research. In this statistics lesson, students investigate how to incorporate statistics into research and other readings besides math. They collect data based on other topics, analyze the...
National Wildlife Federation
Summer Midnight Sun
Sunlight hours and climate have a clear connection. Young researchers collect data about the sunrise and sunset times in an Arctic climate as well as the average temperatures. They then graph their data to make connections between the...
EngageNY
Estimating Probability Distributions Empirically 2
Develop probability distributions from simulations. Young mathematicians use simulations to collect data. They use the data to draw graphs of probability distributions for the random variable in question.
Curated OER
Maryland’s Chesapeake Bay Landscape Long Ago and Today
Combine a fantastic review of primary source analysis with a study of Captain John Smith's influence on the Chesapeake Bay region in the seventeenth century. Your young historians will use images, a primary source excerpt, and maps...
EngageNY
Nonlinear Motion
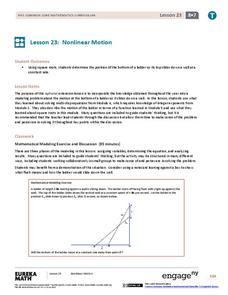
Investigate nonlinear motion through an analysis using the Pythagorean Theorem. Pupils combine their algebraic and geometric skills in the 24th lesson of this 25-part module. Using the Pythagorean Theorem, scholars collect data on the...
Just Health Action
Environmental Justice Matters: Mapping Cumulative Impacts (Part 2)
A case study enables class members to confirm whether different geographic parts of Seattle, Washington have disproportionate environmental burdens and benefits. Groups use the EPA's Cumulative Health Impact Analysis formula and...
National Wildlife Federation
Why All The Wiggling on the Way Up?
Some of the CO2 emitted by burning fossil fuels is removed from the atmosphere by natural sinks, such as the ocean. The fifth engaging lesson in the series of 21 examines the CO2 data from three very different locations. It then makes a...
Chicago Botanic Garden
Micro-GEEBITT Climate Activity
A truly hands-on and inquiry based learning activity bridges all the lessons in the series together. Beginning with a discussion on average global temperatures, young meteorologists use real-world data to analyze climate trends in order...
Curated OER
The Hot Dog Stand
Students run a computer simulation. They collect data as they work and use the data to create an annual report for their business. Several different simulations could be used for this project. It is desirable for students to do this...
Curated OER
Counting
First graders explore collecting data. They collect data using a data collection sheet and enter the data into Excel. Students create graphs using Excel. They share their graphs with the class.
Curated OER
Sunrise-Sunset
Young scholars gather data, make and share predictions about the time of sunrise ans sunset in their area. Patterns are analyzed and shared with students from other areas.
Curated OER
"who Lives in Your House?"
Fourth graders collect data about the people and animals living in their homes, and the students' shoe sizes. They work in groups to enter the information into a database from which they create graphs. They analyze the data to find the...
Curated OER
Village Research
Sixth graders research global warming. In this science lesson, 6th graders collect data in the Waterton Townsite, Apgar Village and St. Mary area. Students interpret the data and form a hypothesis about global warming.
Curated OER
How Does Your Tree Measure Up?
Middle schoolers work in pairs or small groups to gather data about a tree. Each group might gather data about a different tree; all groups might collect data about the same tree; or two teams might gather data about each tree and...
Curated OER
Probability: The Study of Chance
Students conduct an experiment, determine if a game is fair, and collect data. They interpret data, then display line graph. They conduct analysis of game for probability.
Curated OER
Evaluate Ecosystems
Ninth graders conduct an environmental inventory on one ecosystem. They collect data, and write an environmental impact statement on that area. Students explain the interactions between different systems found within an ecosystem....
Curated OER
Graph Lesson
First graders collect data on different eye colors of each student in their classroom. They input the data that they gathered in an Excel spreadsheet and then create a graph in Excel.
Curated OER
Where is Everybody?
Learners collect data from different grade levels at their school and develop thematic maps which show population density, and determine how this might affect the school and themselves in the future.
Curated OER
"Mummies--The Great Cover Up"
Students wrap their mummy, use canopic-style jars for the preserved chicken organs and design and decorate a sarcophagus. They collect data by weighing, measuring and graphing their "mummy" and its organs.
Other popular searches
- Collect and Organize Data
- Data Collecting
- Data Sets Data Collection
- Collecting and Organizing Data
- Collection of Data
- Data Collections
- Collect and Analyze Data
- Collect and Classify Data
- Collecting and Using Data
- Collect and Organise Data
- Leaf Collection Data
- Games on Data Collecting


