Virginia Department of Education
Average Atomic Masses
Facilitate learning by using small objects to teach the principles of atomic mass in your science class. Pupils determine the average mass of varying beans as they perform a series of competitive experiments. They gather data and...
Teach Engineering
Spring Away!
The last segment of the nine-part unit makes a connection between springs and linear equations. Groups hang weights from the spring and measure its length. Then, using the data collected, they calculate the slope to find the k-value of...
Curated OER
Sky Observations Sky & Cloud Windows
Young scholars observe the sky and weather to gather data. They conduct experiments to answer questions about the sky and weather phenomena. They measure, analyze and present data. They create sky windows by gluing sky colored paint...
NASA
Rocket Wind Tunnel
Using a teacher-built wind tunnel constructed from a paper concrete tube form, a fan, and a balance, individuals determine the amount of drag their rocket design will experience in flight. Pupils make modifications to increase the...
Radford University
Is it Really a Small World After All?
Working in groups, learners research four countries' populations over the past 30 years. Using the data collected, the teams find regression equations that best fit the data. Taking the regression equations, they then make predictions...
PBS
Investigating Seasonal Temperature and Precipitation Variations
Weather seems unpredictable, but is it really? Learners collect weather data from online interactives and build data displays. They use their displays to identify temperature and precipitation patterns in different areas.
Curated OER
It's Your Life - Safe or Sorry/Safety Issues
Young scholars examine and chart data about safety hazards and unsafe situations. In this safety hazard lesson, students examine newspapers and web sites to investigate injuries from safety hazards. They make a spreadsheet using the data...
Curated OER
Foliage Tracker
Young scholars discuss the change of leaf colors and the role that climate and elevation play in those changes. They then track leaf changes, input data, and graph foliage changes with a free online tool.
Jude Mphoweh
Graphs
Searching for worksheets to include in an elementary math series on bar graphs? Then look no further! This collection of materials has exactly what you need to ensure that your students get plenty of practice reading and analyzing the...
Virginia Department of Education
Scatterplots
Math is all fun and games with this activity! Learners use an activity designed around hula hoops to collect data. They create scatter plots with their data and then analyze the graphs for correlation.
California Education Partners
Science Fair Project
Plant the data firmly on the graph. Given information about the growth rate of plants, pupils determine the heights at specific times and graph the data. Using the information, scholars determine whether a statement is true and support...
Curated OER
Species and Specimens: Exploring Local Biodiversity
Students practice skills essential to all scientific investigation: carefully observing and collecting data. They become field biologists in a series of hands-on activities to collect and identify specimens, and survey and calculate the...
Curated OER
Counting Coins
Second graders identify a quarter, dime, penny, nickel, and dime. They match the coin with it's monetary value, collect data on excel spreadsheet, and create a graph in Excel. Students participate in group activities.
Pingry School
Effect of Solutes on Boiling Point
Anyone that lives around snow knows that adding salts to water increases its melting point. Are there solutes that affect the boiling point as well? A scientific experiment has learners add different solutes to water and then monitor the...
Virginia Department of Education
Heat Transfer and Heat Capacity
It's time to increase the heat! Young chemists demonstrate heat transfer and heat capacity in an activity-packed lab, showing the transitions between solid, liquid, and gaseous phases of materials. Individuals plot data as the changes...
Do2Learn
Teacher Observation Sheet
Collect anecdotal data using a teacher observation worksheet that looks closely at scholars' behavior, their triggers, the behavior's frequency, duration, and setting.
CK-12 Foundation
Two-Sided Stem-and-Lead Plots: Gamers
Which gender spends more time playing video games? Your classes use provided data to answer this question. They first build a two-sided stem-and-leaf plot and then use the display to look for patterns. Guiding questions help them...
US Department of Commerce
Census in Counties - Describing and Comparing Histograms to Understand American Life
Use graphs to interpret life in 136 counties. Pupils analyze histograms and describe the shapes of the distributions of data collected from several counties on different aspects of life. Scholars make predictions on the difference in...
Curated OER
Color Burst
Fourth graders explore how colors react in water (chromatography) and other solvents. They observe, investigate, measure, record data and communicate their results in the form of graphs/charts and narration presented to the class....
Virginia Department of Education
Radioactive Decay and Half-Life
Explain the importance of radioactive half-life as your high school biologists demonstrate the concept by performing a series of steps designed to simulate radioactive decay. Pupils use pennies to perform an experiment and gather data....
University of Georgia
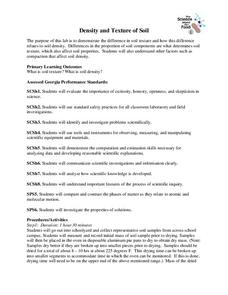
Density and Texture of Soil
All soil is not created equal! A lab activity asks learners to collect and analyze soil. Specific calculations determine the amount of sand, silt, and clay in a sample and allow individuals to identify the soil texture.
Cornell University
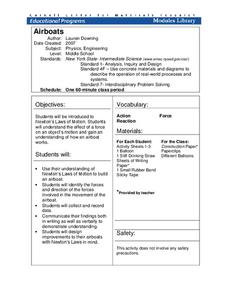
Airboats
Don't let the resource blow you away. Scholars build airboats from basic materials and collect data on how far the boats move. They refine their designs taking Newton's laws into consideration.
College Board
2015 AP® Statistics Free-Response Questions
Statistics is all about making inferences. Can you infer how your pupils will fair on their AP® exams? Collect your own data by giving them practice tests such as the 2015 free-response exam. The six-question test includes topics such as...
101 Questions
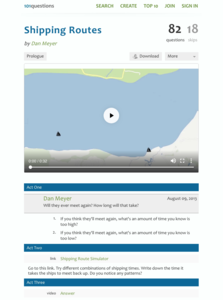
Shipping Routes
The product of the hard work is learning. Scholars use a simulation tool to collect information to analyze. They must decide when two ships traveling back and forth across a river at different rates will meet on the same side. The intent...
Other popular searches
- Collect and Organize Data
- Data Collecting
- Data Sets Data Collection
- Collecting and Organizing Data
- Collection of Data
- Data Collections
- Collect and Analyze Data
- Collect and Classify Data
- Collecting and Using Data
- Collect and Organise Data
- Leaf Collection Data
- Games on Data Collecting


