Curated OER
Trends of Snow Cover and Temperature in Alaska
Students gather historical snow cover and temperature data from the MY NASA DATA Web site. They compare this data to data gathered using ground measurements from the ALISON Web site for Shageluk Lake. They graph both sets of data and...
Polar Trec
Ozone Data Comparison over the South Pole
Did you know the hole in the ozone is seasonal and filled by January every year? The lesson uses scientific measurements of the ozone over the South Pole to understand patterns. Scholars learn that the hole grew bigger annually before...
NOAA
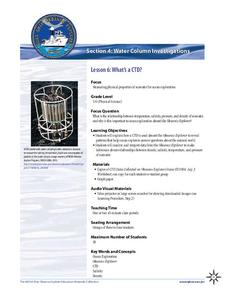
What's a CTD?
Why are the properties of the water important when exploring the ocean? Young scientists discover the tools and technology used in deep sea exploration in the fourth installment in a five-part series. Groups work together to examine...
Curated OER
Voter Turnout
Explore politics by analyzing the voting process. Pupils discuss the purpose of casting votes in an election, then examine graphs based on the data from a previously held election's turnout. The instructional activity concludes as they...
Space Awareness
The Thermal Layers of Oceans
How much does the sun heat up a lake or ocean? Scholars use a cup and a strong lamp to investigate the heat transfer and thermal layers in the ocean to come up with the answer. They collect data and graph it in order to better understand...
Teach Engineering
What a Drag!
Stop and drop what is in your hand! Pupils investigate how form effects drag in the 12th part of a 22-part unit on aviation. Groups create equally weighted objects and determine which one falls the fastest by collecting data.
NASA
The Types of Clouds and What They Mean
Learn to forecast the weather using cloud types. Budding meteorologists identify cloud types and learn to use a dichotomous key. As scholars develop observation and identification skills, they discover how different cloud types cause...
Curated OER
Comparing Pulse Rates
Young scholars participate in a lab that demonstrate one example of how the human body maintains homeostasis. Students collect data from themselves and observe how their own bodies react to exercise.
Rochester Institue of Technology
Patient Flow
It's time to redesign the healthcare system. The seventh installment of a 9-part technology/engineering series teaches future engineers about patient flow and how to design healthcare centers to improve flow. Classroom simulations allow...
NOAA
Climate, Weather…What’s the Difference?: Make an Electronic Temperature Sensor
What's the best way to record temperature over a long period of time? Scholars learn about collection of weather and temperature data by building thermistors in the fourth installment of the 10-part Discover Your Changing World series....
BioEd Online
Butterflies in Space
How does gravity affect the life cycle of a butterfly? Learn first-hand what types of investigations astronauts perform in space by following along with one of NASA's experiments. Create butterfly habitats in the classroom with specific...
Curated OER
Questioning NASA
Space science and math collide in this inquiry that investigates launching times for antacid-tablet rockets! Upper elementary or middle school learners collect data as they launch these mini rockets. They apply concepts of place value...
PLS 3rd Learning
Interpreting Heart Rates During Various Physical Activities
Learners review terminology: pulse, heart rate, target heart rate zone. They work in three groups, and assigned to one of three activity stations. At 5-minute intervals, 4th graders check their pulse and record it on their group card....
Curated OER
Solar Kit Lesson #8 - Positioning Solar Panels II: Explorations with Stationary Panels
This lesson plan is preparation-intensive, but well worth the investment. You will construct five or six portable testing stations with which lab groups will gather data on the best position for collecting sunlight with a solar panel....
EngageNY
The Difference Between Theoretical Probabilities and Estimated Probabilities
Flip a coin to determine whether the probability of heads is one-half. Pupils use simulated data to find the experimental probability of flipping a coin. Participants compare the long run relative frequency with the known theoretical...
Curated OER
M&M Science and Math
A series of math and science activities feature M&M's® as manipulatives to help kids work through equations. The resource includes exercises on finding averages, percent of compositions, moles in chemical reactions, genotypes and...
Curated OER
Dependence of Light Intensity on Distance
Hopefully you have a sensor interface for your physics class to use with graphing calculators when collecting data with a light sensor. If so, read on. Use this resource for learners to predict and then test whether or not the intensity...
Virginia Department of Education
Molar Heat of Fusion for Water
How can you describe heat of fusion in a way the class understands and relates the importance of this concept to present day issues? In this third lesson of the series, learners conduct an experiment, demonstrating the flow of heat...
Beyond Benign
Exothermic and Endothermic Reactions
How can you tell the difference between endothermic and exothermic reactions? Chemistry scholars perform and observe two chemical reactions, measure the temperature throughout, then draw conclusions about changes in energy from their...
Curated OER
Acceleration Lab
Young Einsteins experiment with the acceleration of Hot Wheels™ toy cars down inclined planes at various angles. This classic physics lab activity is thoroughly explained in both a teacher’s guide and a student lab sheet. Science...
Curated OER
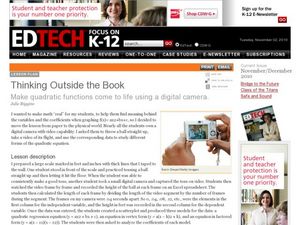
Thinking Outside the Box
Now this lesson sounds fun! Learners throw a ball, film it as it soars through the air, and use a spreadsheet to collect data. A scatterplot is created to produce a quadratic regression equation, an equation in vertex form, and an...
Virginia Department of Education
Electricity and Magnetism
Take charge of your class and provide them with an electrical experience! Individuals investigate the basic principles of electricity and magnetism by creating a model to test electric current and the amount of electricity generated....
National Nanotechnology Infrastructure Network
The Effects of Gold and Silver Nanoparticles on Brine Shrimp: A Toxicology Study
Who doesn't love gold and silver? Brine shrimp, that's who! Learners conduct an experimental lesson plan to monitor the toxicity of gold and silver nanoparticles on brine shrimp. They synthesize solutions to expose the brine shrimp to...
101 Questions
Coins in a Circle
Round and round you'll go! Learners watch as different-sized circles fill with coins. They collect data and then make a prediction about the number of coins that will fit in a large circular rug.
Other popular searches
- Collect and Organize Data
- Data Collecting
- Data Sets Data Collection
- Collecting and Organizing Data
- Collection of Data
- Data Collections
- Collect and Analyze Data
- Collect and Classify Data
- Collecting and Using Data
- Collect and Organise Data
- Leaf Collection Data
- Games on Data Collecting


