Teach Engineering
A Shot Under Pressure
You've got to pump it up! Using the equations for projectile motion and Bernoulli's Principle, class members calculate the water pressure in a water gun. The pupils collect data on the number of pumps and distance traveled in order to...
NASA
The Invisible Sun: How Hot Is It?
It's getting hot in here! The first in a series of six lessons has learners model nuclear fusion with a simple lab investigation. Groups collect data and analyze results, comparing their models to the actual process along the way.
Kenan Fellows
Absorbance Curves: Using Spectrophotometers to Quantize the Effects of a Strong Acid on a Buffer
The Henderson-Hasselbalch equation combined logarithmic terms with the application of carbonic acid as a buffer solution. Scholars learn investigate equation and its applications through hands-on experiments. They collect data and...
Alabama Wildlife Federation
Big Fish, Little Fish
Tag, you're eaten! A instructional activity on predator-prey relationships uses the game freeze tag as a model. Learners become either a predator or prey and play a game of tag as the prey tries to reach areas that house food and...
Curated OER
Designing the Experiment and Answering the Question
Students investigate scientific methods by analyzing an article from the Natural Inquirer. In this data analysis lesson plan, students read an article from the magazine and discuss at least 2 scientific methods that could be used to...
New York State Education Department
English Language Arts Examination: August 2015
Assessing a variety of skills using numerous item types is a great way to collect data for formative and summative use. Using a challenging exam, scholars prove their comprehension and reading skills through multiple choice, task, and...
Curated OER
The Landscape of a Novel
Young scholars, after reading a novel, utilize geographic skills to map out the places described in the novel. They collect data, envision spatial features and then design a map to work off of to complete their assignment. Each student...
Pingry School
Synthesis of an Insoluble Ionic Salt: A Stoichiometry Experiment
Challenge young scientists to design their own experimental procedures. They write the procedure for properly preparing two grams of a water-insoluble ionic salt. To finish, they perform the experiment and collect data to prove their...
Curated OER
Rising Gas Prices – Compounding and Inflation
Financial literacy skills and exponential models are connected by the compound interest formula in this task centered on inflation calculations. Collaborative learners get experience collecting data from the given websites and exploring...
Creative Learning Exchange
The Infection Game: The Shape of Change
Encourage the spread of knowledge in your class with this cross-curricular epidemic simulation. Pulling together science, social studies, and math, this lesson engages students in modeling the spread of infectious diseases, collecting...
EngageNY
Grade 9 ELA Module 2, Unit 2, Lesson 15
The terrible truth begins in a instructional activity that focuses on the final act of Sophocles' Oedipus the King. As ninth graders collect evidence that details the origin of Oedipus and how his birth relates to the prophecy everyone...
NASA
Launch Altitude Tracker
Using PVC pipe and aquarium tubing, build an altitude tracker. Pupils then use the altitude tracker, along with a tangent table, to calculate the altitude of a launched rocket using the included data collection sheet.
Virginia Department of Education
Electricity and Circuits
Electrify your classroom as you lead pupils through a series of steps to demonstrate basic principles of electricity and magnetism. They design a simple circuit and test this for static electricity and current electricity. Next, they...
Virginia Department of Education
A-Mazing Plants
Have your young scientists questioned why plants grow a particular way? Through this learning opportunity, scientists gain firsthand knowledge about how plants develop and various factors that affect rates of growth as they bring plants...
WindWise Education
Which Blades Are Best?
If I change the length, will they work better? After brainstorming the variables of wind turbine blade design, groups choose one variable to isolate and test. The groups then present their data to the class in order for all to have the...
EngageNY
Interpreting Expected Value
Investigate expected value as a long-run average. The eighth installment of a 21-part module has scholars rolling pairs of dice to determine the average sum. They find aggregate data by working in groups and interpret expected value as...
Nuffield Foundation
Investigating Factors Affecting the Breathing Rate of a Locust
Do animals breathe faster when given more oxygen or more carbon dioxide? Young scientists observe the respiration rates of locusts under a variety of gas concentrations to answer that very question. They collect data, analyze the...
Curated OER
Is Global Warming Happening?
Students investigate the probability of global warming and the effects of global warming on the environment. They conduct Internet research and collect data, transfer the data onto an Excel spreadsheet, and create a presentation that...
University of Georgia
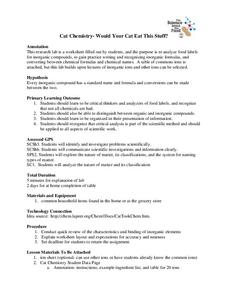
Would Your Cat Eat This Stuff?
Processed foods use inorganic compounds for flavoring and preservation. This take-home laboratory challenges scholars to find 20 different compounds identified on the labels of foods to list on their data collection sheet. The activity...
Curated OER
How to Graph in Excel
Fourth graders construct data graphs on the Microsoft Excel program. In this statistics instructional activity, 4th graders formulate questions and collect data. Students represent their results by using Excel.
Curated OER
Monopoly Graphs
Students relate the concepts of linear functions to the game of monopoly. For this algebra lesson, students solve problems with ratio and proportion. They collect data and graph it.
Curated OER
Egg Hunt
Middle schoolers make detailed qualitative and quantitative observations. They are introduced to the process of developing repeatable procedures. Students practice collecting data. They review measurement skills. Middle schoolers...
Curated OER
Conditions at Sea Introductory Activity, Making Waves
Students explore waves and wind. In this physical and earth science wave instructional activity, students participate in a wave making activity with an aquarium and a hair dryer. Students complete a data chart recording wave height and...
Curated OER
Environmental Issues in Multimedia Presentation
Students investigate a community environmental issue. They document it using traditional scientific methods, digital photography, and videotaping. After collecting data, they graph the results. Students present their findings in a...
Other popular searches
- Collect and Organize Data
- Data Collecting
- Data Sets Data Collection
- Collecting and Organizing Data
- Collection of Data
- Data Collections
- Collect and Analyze Data
- Collect and Classify Data
- Collecting and Using Data
- Collect and Organise Data
- Leaf Collection Data
- Games on Data Collecting


