Curated OER
ELECTROMAGNETS
Learners use video learning and construct electromagnets and use them to collect data, graph, and share with others.
Curated OER
Lobster Roll!
Students collect data by playing a game that illustrates the delicate ecological balance between fishing, fishing regulations and fish populations. They graph and analyze the data and explain how economic decisions can affect the...
Curated OER
Global Warming Statistics
Learners research and collect data regarding temperature changes for a specific location and find the mean, median, and mode for their data. In this climate change lesson plan, students choose a location to research and collect data...
Curated OER
Bottle Habitat
In groups of four, students construct aquatic habitats in pop bottles. They create charts and record data from observations over a four week period. Then they graph their data and write explanations for what they observed.
Curated OER
River Optimization Problem
Students define the different methods used for optimizing a particular element of a problem. In this optimization problem lesson, students optimize appropriate details of a problem using data collection, algebra, technology, and/or...
Curated OER
A Steep Hike
Students explore slope. In this middle school mathematics lesson plan, students analyze and interpret graphs as they investigate slope as a rate of change. Students use a motion detector to collect data as they walk at different speeds...
Curated OER
After the Garbage Can: Where Does Our Trash Go?
Learners explore how waste disposal has changed over time and what the current issues are. In this disposal instructional activity students collect data and create graphs.
Curated OER
Microclimates of Our School
Students read the story "Weslandia" by Paul Fleischman, define the term microclimate, gather and record data in various places on school grounds to establish the presence of difference microclimates, analyze and compare microclimates,...
Curated OER
How Long? How Wide?
Second graders distinguish between and use nonstandard and standard units of measurement, use appropriate tools and techniques to measure length and width, and record and interpret data using graphs.
Curated OER
Conservation of Mass
In this conservation of mass worksheet, students design an investigation to demonstrate the Law of Conservation of Mass. Students describe their investigation, collect data, graph the data and write a conclusion about what they discovered.
Curated OER
Weather "Whys" Lesson 2 Seasons
Young scholars explore seasons. In this cross curriculum weather and seasons lesson plan, students identify characteristics of the four seasons and sequence related pictures. Young scholars listen to poems and stories about trees in...
Curated OER
Square Foot Garden
Students plant a garden and keep track of it. In this geometrical garden lesson plan, students collect data from their garden twice a week. They graph their finding and figure out how many square feet of growing space each person needs...
Curated OER
Paint Property Experiments
Students identify various kinds of paints by using the scientific method. In this solvents lesson students collect data and identify paint samples while working in teams.
Curated OER
Poetic Math Greeting Cards
Fourth graders work in groups; collect data in a survey; depict in tables, charts, or graphs the results of the survey; and make predictions. They use creative writing skills and computer skills to generate a greeting card of their own.
Curated OER
Pick's Theorem
Students investigate polygons and their lattice. In this calculus lesson, students record data using different methods. They analyze their data and draw conclusions based on the relationship between the area and the interior lattice.
Curated OER
Displaying Populations: Jellybeans, Paper and People
Students investigate the factors affecting population growth. In this biology lesson, students collect data from the lab and graph them. They estimate population size using a mathematical formula.
Curated OER
Adhesives: How Sticky is Your Tape?
Students test the adhesive strength of different tapes. In this adhesive lesson, students conduct an experiment to test the shear strength of the adhesives, take measurements, record data, and draw conclusions to explain each product's...
Curated OER
Fluke: Whale Watching Activity
Sixth graders observe and record data about humpback whales in Hawaii. In this humpback whale watching lesson, 6th graders watch the activity of whales from a Hawaiian beach. They record data about their behavior and complete a research...
Curated OER
Charting the Weather
Students research and conduct non-experimental research, such as journals, the weather channel and the internet, to collect and record data for analysis on weather conditions in the United States and abroad. They identify, pronounce and...
Curated OER
Introduction to Lego Robotics
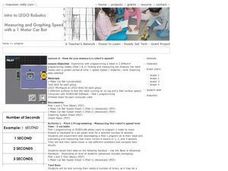
Students utilize computer programs to operate a simple robot. In this technology lesson, students create robots using Lego pieces and simple motors to move them. Students measure the speed of the robots by running Robolab software on...
Curated OER
Ocean Temperatures
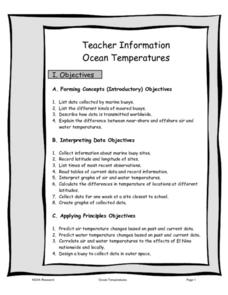
Students list data collected by marine buoys and the different kinds of moored buoys. They describe how data is transmitted worldwide. They explain the difference between near shore and offshore air and water temperatures.
Curated OER
Show Me!
Students analyze and interpret graphs. In this graphing lesson, students view a video and construct their own graphs (line, circle, bar) from given sets of data.
Curated OER
Bats and Hot Dogs
Students identify patterns and relationships from data that is collected and solve variables. In this investigative lesson students study ocean productivity, the nitrogen cycle and phytoplankton then answer questions.
Curated OER
Local Traffic Survey
Young scholars conduct a traffic survey and interpret their data and use graphs and charts to display their results.


