Curated OER
Food Ways - Graphing
Sixth graders choose the appropriate graph to display collected data. They interview each other on what foods they eat. They also interview elders and find out what types of food they grew up eating. They create graphs to display the...
Curated OER
Using Averages to Create Graphs Through Excel
Sixth graders create and use a spreadsheet to make graphs which will be used to analyze Progress Report and Final Report Card grades. They practice finding the mean, median, mode, and range of a data set. Students also incorporate column...
Curated OER
Fast Food Survey Using Bar Graphs
Second graders conduct survey and sort data according to categories, construct bar graph with intervals of 1, and write a few sentences about their graphs.
Curated OER
Pet Count Excel Graphing
Learners used collected data to distinguish what pets they have or would like to have. They correlate findings with appropriate technology--Excel. At the end of the lesson they tabulate a bar chart and present their findings to the class.
Curated OER
Rouge River Data
Students participate in using Excel sofware in order to create graphs. They create the graphs using data that they gathered during the Rouge River Field Trip they attended. The produce bar graphs from the excel spreadsheets.
Curated OER
Chart/Graph
Students create a class survey, place the data in a spreadsheet and graph the information.
Curated OER
Sleepy Time
pupils collect and interpret data about their own sleep patterns, as well as family members. Students graph their results and compare with others in the class. Pupils identify and interpret healthy sleep patterns and behaviors.
Curated OER
Make a Bar Graph
In this bar graphs worksheet, students use the tally chart to make a bar graph. Students color one box for each tally mark and then use the chart to help answer the questions about the sunny, cloudy, and rainy days.
Curated OER
Graphing Predator/Prey Data
Students use data from the Camouflage Game (played with red and green yarn caterpillars) to create a composite bar graph to display the collected data. They interpret the data and form a conclusion based on the graphs. Teachers may use...
Curated OER
TE Activity: Heavy Helicopters
Young scholars study the concepts of weight and drag while making paper helicopters. They measure how adding more weight to the helicopter changes the time for the helicopter to fall to the ground. They apply what they examine to the...
Virginia Department of Education
Curve of Best Fit
Which function models the data best? Pupils work through several activities to model data with a variety of functions. Individuals begin by reviewing the shapes of the functions and finding functions that will fit plotted data points. By...
Curated OER
Water Down the Drain
Did you know that leaky faucets waste $10 million worth of water? Conservationists perform an experiment and draw best-fit lines to explore how the US Geological Society determined this value.
NOAA
Biological Oceanographic Investigations – Keep Away
As of 2015, there are 53,481 oil wells in the Gulf of Mexico. Scholars determine how species diversity is impacted based on the ecosystem's distance from a drilling platform. It focuses on finding the mean of data sets...
University of Colorado
The Moons of Jupiter
Middle schoolers analyze given data on density and diameter of objects in space by graphing the data and then discussing their findings. This ninth installment of a 22-part series emphasizes the Galilean moons as compared to other...
University of Colorado
The Moons of Jupiter
Can you name the three planets with rings in our solar system? Everyone knows Saturn, many know Uranus, but most people are surprised to learn that Jupiter also has a ring. The third in a series of six teaches pupils what is around...
Curated OER
Exploring Careers
The world is full of possibilities for your ELLs. Help them explore their career options with a lesson that incorporates Internet research and expository writing. Not only will they learn more about their careers of choice, but both...
West Contra Costa Unified School District
Writing Exponential Functions Based on Data
Give your class a concrete example of exponential growth and decay using this hands-on activity. These Algebra II lessons allow for the exploration of exponential growth and decay models, as well as the discovery of the patterns of...
Teach Engineering
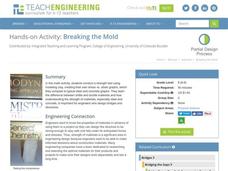
Breaking the Mold
A little too much strain could cause a lot of stress. Groups conduct a strength test on clay. Using books as weights, pupils measure the compression of clay columns and calculate the associated strain and stress. Teams record their...
Michigan State University
Bug Lyphe!
Introduce ecology classes to biodiversity and interdependence in ecosystems with a PowerPoint presentation. Then, they get up-close and personal with the invertebrate world by collecting insects, classifying them, and graphing their...
National Wildlife Federation
Why All the Wiggling on the Way Up? CO2 in the Atmosphere
The climate change debate, in the political arena, is currently a hot topic! Learners explore carbon dioxide levels in our atmosphere and what this means for the future in the 11th installment of 12. Through an analysis of carbon dioxide...
EngageNY
Modeling Relationships with a Line
What linear equation will fit this data, and how close is it? Through discussion and partner work, young mathematicians learn the procedure to determine a regression line in order to make predictions from the data.
Virginia Department of Education
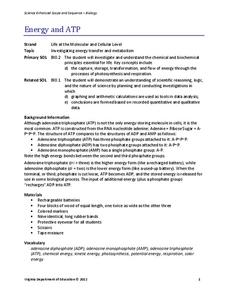
Energy and ATP
Take charge of your biology class by using this exciting analogy to relate the ATP process with batteries. Pupils use batteries and rubber bands to simulate the phosphate bonds between molecules in the body. They measure the distance in...
Howard County Schools
Planning for Prom
Make the most of your prom—with math! Pupils write and use a quadratic model to determine the optimal price of prom tickets. After determining the costs associated with the event, learners use a graph to analyze the break even point(s).
Curated OER
Influence and Outliers
Using the TI-Nspire calculator, statisicians identify outliers and their effect on the least-squares regression line. In finding the line of best fit, they determine what points will affect the least squares regressions and what points...


