Curated OER
History Repeats Itself
Twelfth graders research historical turning points, gather-data, and extrapolate possible alternate outcomes. They work individually to choose one historical event from Attachment D, Historical Turning Points. Students complete either...
Curated OER
Local Traffic Survey
Young scholars conduct a traffic survey and interpret their data and use graphs and charts to display their results.
Curated OER
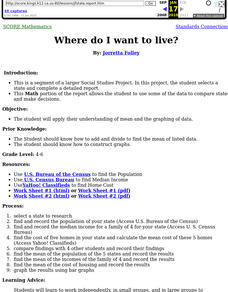
Where Do I Want To Live?
Students use a variety of Internet sources to gather income, population and housing data. Each group bring their results to the class and the class use their findings to compile mean population, income, and housing for all states.
Curated OER
Getting to Know You
Students converse with each other while playing a game in order to discover things that are alike and things that are different about themselves. The students gather data about themselves, organize and display data on the graph, and...
Curated OER
Hemlock Trees and the Pesky Pest, The Woolly Adelgid
Students review Excel and how to create graphs with this program. They create two graphs in Excel, one showing the average number of woolly adelgid egg sacks on the outer 15 cm of hemlock branch at sites sorted by latitude, then one...
Curated OER
What Does the Sun Give Us?
Pupils study the sun and how solar energy works. To learn about renewable energy, they complete a lab activity using a pizza box as a solar heater. Quite clever!
Science-Class.net
Rock Candy Crystals
Candy is one of my favorite words, and it's an even better word when it relates to science. Yes, candy science can happen when you grow rock candy crystals with your class. The entire process for growing these edible wonders of nature is...
Federal Reserve Bank
Cash Flow and Balance Sheets
What is your car worth? How much do you owe? Individuals create their personal cash flow and balance sheets. They learn the difference between an asset and liability using their personal information to complete the activity.
Science 4 Inquiry
Snakes in the Everglades
The Burmese python is on the loose ... and he's hungry! Illustrate the differences between causative and correlative relationships through an inquiry instructional activity. Pupils examine several sources of information to determine if...
Curated OER
Protocol for Backyard Bird Research Project
Young scholars investigate a hypothesis about birds in their backyard using identification and survey skills.
Curated OER
Introduction to Flight: A Math, Science and Technology Integrated Project
Seventh graders review graphing procedures and practice locating points using x,y coordinates. Students calculate the areas of the top and bottom surfaces of the airfoil. They construct a test model of the airfoil.
Curated OER
Unit 2: Lesson 7
Students are introduced to spreadsheets. They conduct a survey of television viewing time of different shows based on different age categories. Students work in small groups. They collect, data and interpret the data from a survey.
Curated OER
Science Reporter for Where in the World is Science? Project
Students take the role of a science reporter and gather data for a newspaper article. Students create a question sheet. Students receive a copy of the Science Reporter's Journal task sheet. They complete the items on the sheet and...
Curated OER
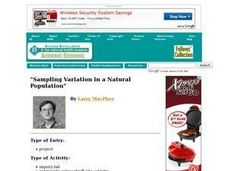
Sampling Variation in a Natural Population
Students examine the phenotypic variation within a natural population of a single species. They collect data on the species and analyze the data using statistical/spreadsheet software. Students interpret their results and present their...
Curated OER
Spring Collecting and Identifying Bumble Bees
Students collect bumble bees in the field, record data, identify and release specimens, answer conclusion questions, and send data in to researcher leaders. They make research based conclusions based upon the evidence.
Curated OER
Investigation 6 - Collecting Weather Data
Fourth graders collect data for two weeks. They start seeing patterns and make predictions. They can predict what the weather be like the next day and for the next few days. They see if their predictions were correct from the previous day.
Curated OER
Spring Collecting and Identifying Bumble Bees
Young scholars collect bumble bees in the field, record data, pin and label specimens, answer conclusion questions, and send specimens to research leaders for verification. They improve their ability to work in research teams. Students...
Curated OER
Descriptive Statistics
Students demonstrate how to use frequency and scatter diagrams. In this statistics lesson, students are introduced to different techniques of representing data. Students sort and graph data on a worksheet and use a frequency diagram to...
Curated OER
Sampling Distribution of Sample Means
Students collect data and crate a distribution sample. In this statistics lesson, students compare and contrast their collected data. This assignment requires the students to be comfortable with navigating the internet.
Curated OER
Air Pollution: Visible And Invisible
Fourth graders observe air pollution that is visible and invisible with experimentation. During the experiment the students collect data that needs analysis. The observations are recorded in the lab journal. The data also is represented...
Curated OER
Surveys
Students collect data from middle school survery. They tabulate percentages by grade level. They create a graph to display the survey results.
Curated OER
Creek Restoration Project
Students gather and analyze scientific data from a local creek. Over weeks or months, students observe their local environment, collect water samples, and evaluate test results. Extension activities are suggested for evaluating...
Curated OER
Project Geode
Pupils predict the appearance of a geode's internal structure based on its mass and density. They form a hypothesis based on the data they collect. They also identify common minerals found in Illinois.
Curated OER
Peat Pots
Students place a peat pot in water to observe and calculate the rate of capillarity in a model of a soil. This task assesses students' abilities to make simple observations, collect, record, and represent data, use a data table to...


