Curated OER
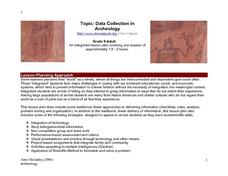
Data Collection in Archaeology
Students research different types of rock art and categorize it into basic groups, classify Powerpoint Images according to interpretation, enter findings into Access template, and interpret results after comparing information with rest...
Curated OER
Remembering Our Veterans Data Management Project
Seventh graders utilize data collected from various sources based on Canadian military statistics to consolidate their understanding of data management. Students plan and create a PowerPoint presentation using this data including in...
Curated OER
I Search My Family Project
Students research their family's heritage. They follow a guide, document their family's history and put it together in report form.
Teach Engineering
Study Design for Air Quality Research
Provide your class with the tools they need to design a research project. Groups examine case studies to gain information about the process involved in designing a research project. They use materials provided to brainstorm and develop a...
Radford University
Sleep and Teen Obesity: Is there a Correlation?
Does the number of calories you eat affect the total time you sleep? Young mathematicians tackle this question by collecting their own data and making comparisons between others in the class through building scatter plots and regression...
Spartan Guides
Infographics Lesson
An infographic is fantastic way for learners to illustrate their understanding of content, express themselves creatively, and teach others in a manner that is both engaging and informative. While originally designed for a lesson on...
Curated OER
Beans and Baleen
Predict whale populations using different beans as whales! Learners observe different types of beans in a dish knowing that each bean represents a different kind of whale. They then predict how many "whales" there are in a certain area....
EngageNY
Relationships Between Two Numerical Variables
Is there another way to view whether the data is linear or not? Class members work alone and in pairs to create scatter plots in order to determine whether there is a linear pattern or not. The exit ticket provides a quick way to...
Curated OER
Technology Integration Project Weather Unit Plan
High schoolers use a variety of technology-assisted weather observation tools to observe and record local weather. They identify, measure and record weather conditions, summarize types of clouds and make graphs of their observations....
Teach Engineering
Breaking the Mold
A little too much strain could cause a lot of stress. Groups conduct a strength test on clay. Using books as weights, pupils measure the compression of clay columns and calculate the associated strain and stress. Teams record their data...
Berkshire Museum
Reduce, Reuse, and Recycle: Sorting Through Personal Choices
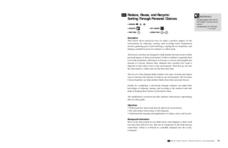
Raise children's awareness about the importance of conservation with this hands-on science lesson plan. Start by breaking the class into groups and having them collect trash from around the school or local park. Students then use the...
Kenan Fellows
Using Water Chemistry as an Indicator of Stream Health
Will this water source support life? Small groups test the chemistry of the water drawn from two different sources. They then compare the collected data to acceptable levels to draw conclusions about the health of the source. The...
Magic of Physics
Unit Converter I
Talk about a cool tool! Convert between units with the click of a mouse using a handy online resource. Enter the starting measurement and units for quantities such as torque, speed, and inertia, then sit back and relax while the computer...
National Park Service
Pulley Systems Used at Fort McHenry
What a great opportunity to integrate science into your lesson on the War of 1812! Discover how pulley systems were used to move 1,000 lb. cannons at the Battle of Fort McHenry, and to raise the flag that would inspire Francis Scott Key...
Sea World
Splash of Math
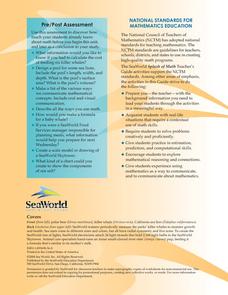
How can kids use math to learn about marine life? Combine math skills with science lessons in a resource featuring activities about life in the sea. Kids graph and calculate data, solve complex word problems, measure geometric shapes,...
Curated OER
Data Analysis
Students double check their data collections of Top 20 singles that they've been collecting for several days. Types of data is reviewed in detail and a variety of questions are asked for retention factors of mastery. They draw a tally...
Curated OER
Confidence Levels
Learners collect data and graph it. In this statistics lesson, students rate confidence levels by collecting data and analyzing it. They graph their findings on the Ti calculator.
Curated OER
Bones and Math
students identify and explore the connection between math and the bones of the human body. Students collect data about bones from their classmates and from adults, apply formulas that relate this data to a person's height, and organize...
Curated OER
Confusing Colors!
Fourth graders collect data, graph their data, and then make predictions based upon their findings. They's interest is maintained by the interesting way the data is collected. The data collection experiment is from the psychology work of...
Curated OER
Weather and its Effect on the Environment and Settlement
Students, after choosing two diverse cities, collect data on weather for a month and construct a graph on temperature and precipitation. After collecting population data of said cities, and graphing it, they plot population on a large...
Curated OER
Collect Your Own Drosophila Lab
Students study Drosophila by catching them. They construct catcher-containers to catch Drosophila using fruit as bait. After collection, they examine the flies and collect data to be displayed.
Curated OER
Texas Industries Then and Now
Middle schoolers identify contemporary economic counterparts to industries featured in Texas bird's-eye views by using this website and a "Goods and Services Data Collection Sheet."
Curated OER
A Statistical Study of Three Biomes
Students collect data from one of three selected biomes. Data are then organized and statistically analyzed. This project engages students of different backgrounds grouped cooperatively in a relevant outdoor hands-on learning experience.
Curated OER
Charting the Weather
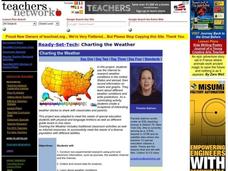
Students research and conduct non-experimental research, such as journals, the weather channel and the internet, to collect and record data for analysis on weather conditions in the United States and abroad. They identify, pronounce and...


