Curated OER
Unit 2: Lesson 7
Students are introduced to spreadsheets. They conduct a survey of television viewing time of different shows based on different age categories. Students work in small groups. They collect, data and interpret the data from a survey.
Curated OER
Science Reporter for Where in the World is Science? Project
Students take the role of a science reporter and gather data for a newspaper article. Students create a question sheet. Students receive a copy of the Science Reporter's Journal task sheet. They complete the items on the sheet and...
Curated OER
Sampling Variation in a Natural Population
Students examine the phenotypic variation within a natural population of a single species. They collect data on the species and analyze the data using statistical/spreadsheet software. Students interpret their results and present their...
Curated OER
Spring Collecting and Identifying Bumble Bees
Students collect bumble bees in the field, record data, identify and release specimens, answer conclusion questions, and send data in to researcher leaders. They make research based conclusions based upon the evidence.
Curated OER
Investigation 6 - Collecting Weather Data
Fourth graders collect data for two weeks. They start seeing patterns and make predictions. They can predict what the weather be like the next day and for the next few days. They see if their predictions were correct from the previous day.
Curated OER
Spring Collecting and Identifying Bumble Bees
Young scholars collect bumble bees in the field, record data, pin and label specimens, answer conclusion questions, and send specimens to research leaders for verification. They improve their ability to work in research teams. Students...
Curated OER
Descriptive Statistics
Students demonstrate how to use frequency and scatter diagrams. In this statistics lesson, students are introduced to different techniques of representing data. Students sort and graph data on a worksheet and use a frequency diagram to...
Curated OER
Sampling Distribution of Sample Means
Students collect data and crate a distribution sample. In this statistics lesson, students compare and contrast their collected data. This assignment requires the students to be comfortable with navigating the internet.
Curated OER
Air Pollution: Visible And Invisible
Fourth graders observe air pollution that is visible and invisible with experimentation. During the experiment the students collect data that needs analysis. The observations are recorded in the lab journal. The data also is represented...
Curated OER
Surveys
Students collect data from middle school survery. They tabulate percentages by grade level. They create a graph to display the survey results.
Curated OER
Creek Restoration Project
Students gather and analyze scientific data from a local creek. Over weeks or months, students observe their local environment, collect water samples, and evaluate test results. Extension activities are suggested for evaluating...
Curated OER
Project Geode
Pupils predict the appearance of a geode's internal structure based on its mass and density. They form a hypothesis based on the data they collect. They also identify common minerals found in Illinois.
Curated OER
Peat Pots
Students place a peat pot in water to observe and calculate the rate of capillarity in a model of a soil. This task assesses students' abilities to make simple observations, collect, record, and represent data, use a data table to...
Curated OER
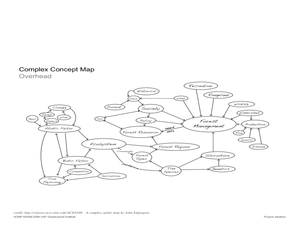
Project Jukebox
Students analyze an interview with the Climate Change Project Jukebox in order to help them undertand how to use a concept map. In this writing and climate change lesson, pairs of students log onto the Internet site for Climate Change...
Curated OER
Probing Under the Surface
Eighth graders use a measuring stick to determine the shape of the inside of the bottom of a box, then apply their knowledge to an additional situation. This task assesses students' abilities to make simple observations, collect and...
Curated OER
Tables, Charts and Graphs
Students examine a science journal to develop an understanding of graphs in science. In this data analysis lesson, students read an article from the Natural Inquirer and discuss the meaning of the included graph. Students create a...
Curated OER
Tree Inventory and Map Project
In this tree inventory and map project worksheet, students follow the directions on how to take inventories of trees and create a map from it. Students follow 4 sets of directions.
Curated OER
Race and Genetics: An Integrated Approach
Students analyze racial issues related to the Human Genome Project. They participate in a mock symposium and write a reflection/position paper based on specific ethical principals.
Curated OER
Formation of Rain
Students sequence the steps leading to the formation of rain, and design a model to represent these steps. This task assesses students' abilities to classify, generalize, infer, interpret and communicate data, and construct a pictorial...
Curated OER
Water, Water Everywhere
Students monitor a local creek. In this environmental water lesson plan, students conduct an environmental study of a local creek by monitoring the temperature and water quality over a period of time, then submit data to the Global Water...
Curated OER
Lemonade for Sale
Third graders engage in a read-aloud of the book, "Lemonade for Sale." They collect data from the story and turn the data into a mathematical graph. This lesson has a rubric for you and the students to follow-very creative lesson.
Curated OER
Fashion Sense and Dollar Wise
Students work in groups to show understanding of the relationship between fractions, decimals, percentages, and the application of ratios and proportions. In this decimals, fractions, and percents lesson, students use real life consumer...
Curated OER
Regions of the United States
Fifth graders collect data about regions of the United States using the Internet, library books, and encyclopedias. They write an essay persuading people to visit their state.


