Scholastic
Study Jams! Scientific Theory & Evidence
Introduce someday scientists to ideas and explanations about how the world around us works by showing this cute cartoon. In it, Mia and Sam discuss what scientific theory is, and how it is important in discovering scientific laws making...
EngageNY
Presenting a Summary of a Statistical Project
Based upon the statistics, this is what it means. The last instructional activity in a series of 22 has pupils present the findings from their statistical projects. The scholars discuss the four-step process used to complete the project...
Chicago Botanic Garden
Preparing for Project BudBurst
Plants take cues from the environment—change in daylight hours and temperature—to complete their seasonal life cycles. Lesson four in the series of six has classes collect phenology data on plants. After taking initial observations,...
Houston Area Calculus Teachers
Collecting Driving Data
Give AP Calculus classes the opportunity to check the accuracy of their calculations! A calculus activity involves the collection of data, the application of mathematics, and the analysis of the accuracy of results. Young mathematicians...
Kenan Fellows
Saving Those Who Save Us: Exploring the Use of Sensors with Data Visualization
Sensor technology is amazingly accurate and useful. Combining the sensor technology and mathematical knowledge, scholars design experiments to answer a question they have developed. Questions may focus on light sensing, temperature...
Radford University
Data Driven
Use the data for a good cause. Groups first analyze provided data and decide which function type would best model the situation. They then investigate a problem relevant to their lives by collecting data and analyzing the results using...
Curated OER
The Hot Dog Stand - An Annual Report
Students run a computer simulation and collect data as they work and use the data to create an annual report for their business. It is desirable for students to do this project individually, but it could be done as a class using a large...
Curated OER
A Research Project and Article For the Natural Inquirer
Get your class to use the scientific process to solve a scientific problem. They utilize the Natural Inquirer magazine to identify a research question which they write an introduction to and collect data to answer. They use graphs,...
EngageNY
Summarizing Bivariate Categorical Data
How do you summarize data that cannot be averaged? Using an exploratory method, learners complete a two-way frequency table on super powers. The subject matter builds upon 8th grade knowledge of two-way tables.
Radford University
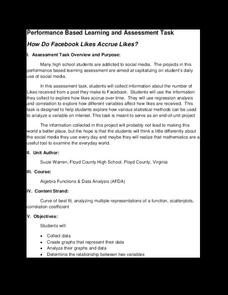
How Do Facebook Likes Accrue Likes?
Finally, a project pupils will instantly like! Young mathematicians collect data on the number of likes they receive for a social media post over time. During the first part of the project, they determine a curve of best fit and...
Curated OER
Graphing It Daily
Students identify and demonstrate a positive learning attitude and use basic concepts and skills. Learners also communicate clearly in oral, artistic, written, and nonverbal form. Finally, students participate in the daily data...
Chicago Botanic Garden
Plant Phenology Data Analysis
Scientists monitor seasonal changes in plants to better understand their responses to climate change, in turn allowing them to make predictions regarding the future. The last activity in the series of six has scholars analyze BudBurst...
Curated OER
Rescue Mission Game
Students conduct probability experiments. For this rescue mission lesson plan, sudents play a game and collect statistical data. They organize and interpret the data and determine the probability of success. Students plot points on a...
Curated OER
Are You Full of Hot Air?
Explore the concept of measuring and recording circumference. In this physical science and measurement lesson, young learners blow up balloons, measure the circumference, and record the data on an interactive graphing website.
EngageNY
Summarizing Bivariate Categorical Data in a Two-Way Table
Be sure to look both ways when making a two-way table. In the lesson, scholars learn to create two-way tables to display bivariate data. They calculate relative frequencies to answer questions of interest in the 14th part of the series.
Teach Engineering
Projections and Coordinates: Turning a 3D Earth into Flatlands
Introduce your class to map projections and coordinates, the basics for the work done in a GIS, with an activity that uses Google Earth to challenge learners to think about the earth's shape.
Omaha Zoo
Monitoring Amphibians
What sort of shoes do frogs wear? Open toad sandals. If your scholars want experience collecting field samples, this is the lesson for you. After learning the proper way to collect field samples, pupils catch amphibians to test for...
Curated OER
Frequency Tables; Discrete Ungrouped Data
For this frequency tables worksheet, students utilize given data to work out three frequency charts with one containing values and a pie chart involving angles for each value. Students complete three vertical line diagrams and check all...
Curated OER
Graphs and Data
Students investigate poverty using graphs. In this algebra lesson, students collect data on the effects of poverty and use different rules to analyze the data. They graph and use the trapezoid rule to interpret the data.
EngageNY
Developing a Statistical Project
The 17th lesson in a unit of 22 presents asks the class to conduct a statistics project. Pupils review the first two steps of the process of asking a question and collecting data. They then begin the process by developing a statistical...
Alabama Learning Exchange
Wheels All Around
Budding mathematicians explore the concept of skip counting. They practice skip counting as they use it to determine the number of wheels that come to school at 3 different times throughout the day. They also create a data graph to show...
NASA
How to Do a Science Fair Project
Build problem-solving skills with science! Step-by-step videos walk investigators through each stage of completing a science fair project. Scientists learn to formulate a testable question, design an experiment, collect data, draw...
Curated OER
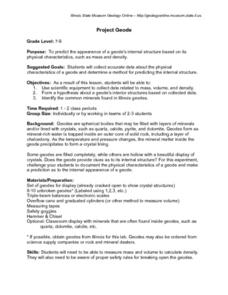
Project Geode
Young geologists attempt to predict the appearnace of a geode's internal structure based on how it looks from the outside, its mass, and its physical characteristics. In this geologly instructional activity, learners use scientific...
Curated OER
Data Collection and Presentation
Young scholars access how to collect, classify and display data involving statistics. The concepts of quantitative, discrete and continuous data is covered in depth within the instructional activity. They practice with a scenario of...


