Curated OER
Detecting Magnetic Materials in "Martian" Soil
Students simulate some of the Pathfinder experiments by devising methods of collecting and measuring magnetic substances in pseudo-Martian soil. The efficiency of each of the methods used to collect materials is evaluated in this lesson.
Curated OER
How Hot Is It?
Sixth graders use paper cups, black and white lining, thermometers and plastic wrap to conduct an experiment that measures the energy-collecting capacity of various colors. They graph the results.
Curated OER
Outdoor Observation
Students examine their outside environment. They use their senses to make observations of the four seasons. They keep a chart of all of the data they have collected.
Curated OER
An Opportunity to access and use the Internet for Research and Study.
Students analyze how to begin hands on research for science projects and experiments. They develop a problem and design a systematic effort to resolve it.
Curated OER
Canadian Cities
Fifth graders gather population data on twelve cities in Canada. They present the information on a spreadsheet and sort the data on two different types of graphs. They create a generalization for the data that they collected.
Curated OER
A Comparative Bilingual Portfolio LessonAbout Japan and Latin America
Students analyze issues and historical questions about Japan as they relate to similar events in Latin America. They use writing, reading, and comprehension skills in completing a research project. Students seek what is similar between...
Curated OER
Discovering the Oasis
Fourth graders explore the ecosystem of Stillwater National Wildlife Refuge Complex. In groups, classmates take pictures and research the species of birds and plants in the area. Over a period of time, 4th graders collect temperature...
Curated OER
Exploration
Young scholars are engaged in a research project about the planet Saturn. The learners use research skills in books and on the internet to gather information for an imaginary trip to the planet. This lesson is highly engaging because of...
Curated OER
Scaling it Down: Caves Have Maps, Too
Measurement and map skills are the focus of this instructional activity, where students crawl through a "cave" made out of boxes, desks and chairs, observing the dimensions. Your young geographers measure various aspects of the...
Curated OER
Keypals and You
Young scholars collect and compare data received from keypals. They use electronic mail to exchange information with keypals and rrite a paper comparing similarities and differences between themselves and their keypals. In addition, use...
Curated OER
Historical Temperatures
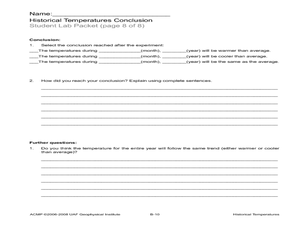
Learners research historical regional temperatures for their current season. In this historical weather lesson, students conduct weather station and Internet research to learn about historical regional temperatures. Learners collect and...
Curated OER
Petrology in the Field and Laboratory
Students collect samples in the field, analyze them using various tools and instruments, then present their results and interpretations. They examine igneous and metamorphic rocks in detail and interpret petrologic data.
Curated OER
Are We Alone
Seventh graders collect/analyze data and draw conclusions; support reasoning by using a variety of evidence; construct logical arguments; access information at remote sites using telecommunications; apply the concept of percent;...
Curated OER
Just Graph It!
Fourth graders evaluate various graphs for the best way to reflect statistical data. They use a spreadsheet to organize data and generate varied graphic representations. They select the graph they feel best shows their results.
Curated OER
You mean college costs that much?
Seventh graders collect, organize, and analyze data as they research colleges on the Internet. They graph their collected data on a line graph and use a spreadsheet on Microsoft Excel in order to organize the data.
Curated OER
Watch Over Wild Wanders
Students collect and organize data relating to migratory species and habitats; undertake a habitat action plan, then maintain planting and building projects for continuing benefit to wildlife; understand the unique needs of migratory...
Curated OER
Earthquakes
Learners research statistics about the last five large earthquakes. They compare data in small groups and present their information orally to the class. They also attempt to predict the next large earthquake.
Curated OER
Glacial Change
Students research the ways in which scientists study glaciers and glacial change. They interpret real time data and calculate the estimated global sea level rise potential. A very good instructional activity to illustrate global warming.
Curated OER
Escape The Hangman
Seventh graders investigate the concept of probability. They use the game of hangman to create engagement and context for conducting the lesson. They create a spreadsheet with data that is given. Students make predictions based on data.
Curated OER
Nebraska Rocks & The Rock Cycle
Learners study the rock cycle and relate it to rocks that are indigenous to Nebraska. Students collect rocks and draw a diagram of the rock cycle using their collection.
Curated OER
Highs and Lows
Young scholars use email to chart weather patterns and then graph their findings. In this weather patterns lesson plan, students chart their weather for a week at the school. Young scholars then use email to find temperatures at a...
Curated OER
Currency Exchange Rates
Students, in groups, choose three countries from which to investigate exchange rates versus the US dollar. Using Internet research they follow daily exchange rates and compute the percentage change. They compile data and prepare and...
Curated OER
Connecting Math to Our Lives
Young scholars participate in an online interactive forum to explore how math is used in their families and communities. They design games to submit to other students online, and identify and organize data to solve the problems from...
Curated OER
It's All in the Air
Students examine air quality. They test the air for visible pollutants by observing jars for one week and compare and contrast the data they collect. After comparing and contrasting the data, they graph the results of pollution...


