Council for Economic Education
Economic Data Lesson: Economic Policy Options
Can you make decisions that will impact millions of people around the nation? Scholars research the role of the Federal Reserve, and its Chairman, on the economic outlook of the country. They analyze current trends in unemployment,...
PHET
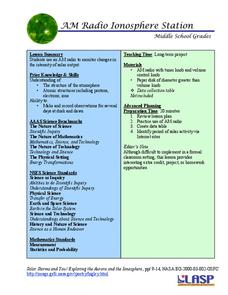
AM Radio Ionosphere Station
Tune in! Young scientists use an AM radio at home to monitor solar output. The long-term project would be ideal in a flipped classroom or as an out-of-class project.
Virginia Department of Education
May I Have Fries with That?
Not all pie graphs are about pies. The class conducts a survey on favorite fast food categories in a lesson on data representation. Pupils use the results to create a circle graph.
Center Science Education
Field Projects: Science in Action
Cooperative groups select from one of four scenarios regarding hurricanes, greenhouse gases, thunderstorms, or the global climate domino effect. They discuss what kind of research needs to be conducted to address their chosen scenario...
Curated OER
Data Display
Students explore different ways to display data. In this statistics lesson plan, students create pie charts, bar graphs and line graphs to show data. Students then write a paragraph discussing which types of graphs are helpful for...
Curated OER
Observe a Tree
Tiny tree-huggers observe and examine various species of trees around campus. They use My First Field Guide to Trees to support their observations. Different tree projects are offered that can include using natural materials to make a...
Curated OER
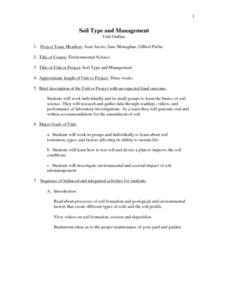
Soil Type and Management
Students study the basics of soil science. They research and gather data through readings, videos, and performance of laboratory investigations. As a team they generate oral and written recommendations for the amendment of soil.
Kenan Fellows
Climate Change Impacts
Turn up the heat! Young mathematicians develop models to represent different climates and collect temperature data. They analyze the data with regression and residual applications. Using that information, they make conclusions about...
Curated OER
Earth's Heavenly Treasures: Hummingbirds
Young ornithologists watch an informative video and use the Internet to gather data about the life, size, habitat, and migration of hummingbirds. The interdisciplinary lesson includes activities that target art, science, math, and...
Curated OER
Data Collection Project
Students collect data using email. They calculate the mean, median, mode, range and outliers. They create a graph using the data results. They write five paragraphs to summarize their data.
Curated OER
Positive Future Fair Project
Ninth graders view the film "Pay It Forward" and discuss what kind of public campaign is needed to move people to positive action. They consider different ways of presenting information (graphs, visual displays, etc.) as tools for...
Curated OER
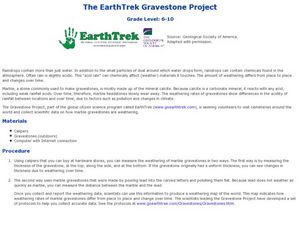
EarthTrek Gravestone Project
Students explore the effects of acid rain. In this acid rain lesson, students investigate the effects of the weathering from acid rain in different places. Students visit cemetaries to collect data about the effects of acid rain on the...
Curated OER
Planning a Trip
Students collect data, organize data, and compute differences of multi-digit numbers. In this data analysis lesson, students put together their best travel plan in small groups as outlined in the first lesson. Students study a map,...
Curated OER
WebQuest Solar System Colonization Project 2000
Sixth graders investigate the livability of different planets in the universe by researching and organizing information from a number of sources in this unit project. They decide on a location for a space station which they support in an...
NOAA
History's Thermometers
How is sea coral like a thermometer? Part three of a six-part series from NOAA describes how oceanographers can use coral growth to estimate water temperature over time. Life science pupils manipulate data to determine the age of corals...
Alabama Learning Exchange
How Old is Your Money?
Elementary learners explore coin mint dates. First, they listen to the book Alexander Who Used to be Rich Last Sunday by Judith Viorst. They then sort a collection of coins according to their mint date and put them in order from oldest...
Bowland
Crash Test
Use mathematics and simulations to investigate car crashes. IScholars test hypotheses involving car crashes. They collect, analyze, and display data from computer simulations to support or refute their hypotheses.
Curated OER
Background of Diseases-- Germs or Genes?
Students explore the background of common diseases. In this personal health lesson, students research causative agents of communicable and non-communicable diseases. Students use their research findings to create data tables in Microsoft...
Curated OER
Dealing with Data in Elementary School
Students follow the scientific method in collecting data. In this following the scientific method in collecting data instructional activity, students develop a question they would like answered such as how many aluminum cans are consumed...
Curated OER
Populations and Life Cycles
Students explore biology by researching ocean statistics. In this data analysis lesson, students conduct a snail examination experiment utilizing live pouch snails. Students collect data about the snails over the course of six weeks and...
Curated OER
2nd Grade - Act. 28: Calendar & Weather Book
Second graders will track the weather patterns throughout the school year. This project spans the school year and takes five minutes per day or less. Measuring, data collection, and predictions are all explored throughout this relevant...
Rochester Institute of Technology
Heat Transfer
Use an exciting role play activity to teach young chemists about the importance of heat transfer in maintaining homeostasis. They assume the role of a dog sled owner who has been abandoned and must fend for themselves with only a few...
Curated OER
Discovering Local Food Chains
Fourth graders study about food chains. With the assistance of a local biologist, Students hike the school trail system. They explore ecosystem and collect data by charting the organisms found and identifying the energy source. They...
Chicago Botanic Garden
Micro-GEEBITT Climate Activity
A truly hands-on and inquiry based learning activity bridges all the lessons in the series together. Beginning with a discussion on average global temperatures, young meteorologists use real-world data to analyze climate trends in order...


