Curated OER
Groundwater and Ecology
Students are presented a problem concerning an aquifer which may be in danger from overuse by agriculture/industry. They compile data and consult online data and experts in creating a proposal to rectify the situation.
Curated OER
Back In The "Old Days"
Fifth graders collect data during their worker interviews while in groups to compile job changes. They analyze the data to determine the categories of changes, patterns/trends of change and future projections. Each group then develops a...
Curated OER
Sweethearts and Data Analysis
Learners explore the concept collecting and representing data. In this collecting and representing data lesson, students record the different colors of sweetheart candies in their sweethearts box. Learners create a table of the data and...
Curated OER
Generating and Recording Data
Students demonstrate their ability to collect, organize, and display data. They examine everyday objects that can be turned into a function machine for the lesson plan. They use colored fish to help them organize their data.
Code.org
Check Your Assumptions
Always check your assumptions when interpreting data and data visualizations. That's the take away from this exercise. Class members examine a failed project that looks at search trends to predict flu outbreaks and consider the...
Math Worksheets Land
Pie or Circle Graphs—Step-by-Step Lesson
How do you display data that you've collected in a pie chart? Follow a clear step-by-step guide to turning survey results into a visible format. It shows kids how to determine the percentage of the whole that each section represents.
Teach Engineering
What's Wrong with the Coordinates at the North Pole?
Here is an activity that merges technology with life skills as individuals use Google Earth to explore the differences between coordinate systems and map projections. The self-guided instructional activity is the fourth segment in a...
Bowland
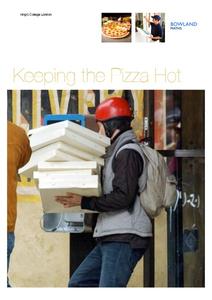
Keeping the Pizza Hot
Learners conduct an experiment to develop a cooling curve for pizza. They consider how this affects pizza delivery in terms of packing material, distance, and delivery routes.
Curated OER
Machine Technology
Students work in pairs to manufacture a product for a potential customer. They interview potential customers and collect data. Students develop a customer interview profile. They manufacture drill drift part to customer's specifications...
Curated OER
Tables and Data
In this tables and data worksheet, 4th graders complete word problems based on the tables and data of students recycling cans. Students complete 8 problems total.
Curated OER
Power Metering Project
High schoolers collect and analyze variable data and understand the concept of electrical power. In this energy lesson students use a spreadsheet to manage their data and create box plots.
Curated OER
An Introduction to Data Reading and Computations
Students discover data reading and computations. In this math lesson plan, students collect nutritional data about intakes of certain foods compared with daily recommended allowances. Students create their own data charts based on their...
Curated OER
Making Good Money Choices
Young scholars identify the needs of their community. In this communities instructional activity, students use a decision-making model worksheet to determine what community service project they should donate to. Young scholars count the...
Curated OER
Analyzing Discrete and Continuous Data in a Spreadsheet
You are what you eat! Your statisticians keep a log of what they eat from anywhere between a day to more than a week, keeping track of a variety of nutritional information using a spreadsheet. After analyzing their own data, individuals...
Curated OER
Heartbeat Project
High schoolers enter information about their heartbeats into a spreadsheet. They construct data displays and calculate statistics. They describe and justify their conclusions from the data collected.
Curated OER
Jelly Bracelets: Fashion or Sex Game?
Ever-changing fashion fads are the ideal context for an engaging sociology experiment for adolescents. Through research and conducting a survey, learners draw conclusions about the controversial jelly bracelets fad, banned in some...
Curated OER
Sex Stereotypes in Society
Students analyze a collection of advertisements or photographs in a text or magazine and identify the stereotypes used or possible biases of the editors. They discuss how these stereotypes are formed, and the ways in which they impact...
Pennsylvania Department of Education
Eye to Eye
Students practice the concept of posing mathematical questions regarding themselves and their surroundings. In this eye to eye lesson, students gather data about eye color from their classmates. Students organize their data in order to...
Curated OER
Mathemafish Population
It's shark week! In this problem, young mathematically minded marine biologists need to study the fish population by analyzing data over time. The emphasis is on understanding the average rate of change of the population and drawing...
Science 4 Inquiry
The Ups and Downs of Populations
Life has its ups and downs ... especially if you're an animal! Biology scholars engage in a population study through an inquiry-based instructional activity. Pupils work together to explore the factors that affect deer populations, then...
Clarkson University
Understanding Energy (With a Pendulum)
Have you ever wanted to play with a giant pendulum? An experiment allows small groups to do just that. They gather data and make observations as they complete the included worksheet. The instructional activity lays out each instruction...
Curated OER
Project Management
Young scholars, in project teams, demonstrate that they are able to successfully plan and manage a construction project. They meet with a customer, work as a team and complete the project to the customer's specifications.
Curated OER
Bias in Statistics
Students work to develop surveys and collect data. They display the data using circle graphs, histograms, box and whisker plots, and scatter plots. Students use multimedia tools to develop a visual presentation to display their data.
Curated OER
Observing the Evidence
Fifth graders explore how to do research from a large group. They explore how to choose a representative sample and collect data from it.


