Curated OER
Aerosol Lesson: Science - Graphing SAGE II Data
Students examine and plot atmospheric data on bar graphs.
Kenan Fellows
Lego Thinking and Building
Run a simulated airplane manufacturing plant with your pupils as the builders! Learners build Lego airplane models and collect data on the rate of production, comparing the number produced to the number defective. Using linear...
Curated OER
Trends of Snow Cover and Temperature in Alaska
Students gather historical snow cover and temperature data from the MY NASA DATA Web site. They compare this data to data gathered using ground measurements from the ALISON Web site for Shageluk Lake. They graph both sets of data and...
Teach Engineering
What a Drag!
Stop and drop what is in your hand! Pupils investigate how form effects drag in the 12th part of a 22-part unit on aviation. Groups create equally weighted objects and determine which one falls the fastest by collecting data.
Curated OER
Questioning NASA
Space science and math collide in this inquiry that investigates launching times for antacid-tablet rockets! Upper elementary or middle school learners collect data as they launch these mini rockets. They apply concepts of place value...
Federal Reserve Bank
Creating a Budget
Learning to create and maintain a budget is an important life skill. Guide individuals in the discovery of their spending habits and how to track them. They then use what they learned to create a budget and make decisions on where they...
Social Media Toolbox
Social Media Survey
Survey says ... social media is here to stay! How do the pupils in your school use social media? Using lesson four from a 16-part series, The Social Media Toolbox, learners study surveys and create their own. The resource includes...
Curated OER
The Landscape of a Novel
Young scholars, after reading a novel, utilize geographic skills to map out the places described in the novel. They collect data, envision spatial features and then design a map to work off of to complete their assignment. Each student...
Curated OER
Gathering Statistics for Research
Learners gather statistics to include in their research. In this statistics lesson, students investigate how to incorporate statistics into research and other readings besides math. They collect data based on other topics, analyze the...
NASA
Launch Altitude Tracker
Using PVC pipe and aquarium tubing, build an altitude tracker. Pupils then use the altitude tracker, along with a tangent table, to calculate the altitude of a launched rocket using the included data collection sheet.
Garden Earth Naturalist Club
Parts of a Flower! Flower Dissection
Sometimes the best way to learn about plants is to see the different parts of a plant yourself. Groups of learners dissect flowers to answer questions about what they observe and what they wonder about their flower.
EngageNY
Grade 9 ELA Module 2, Unit 2, Lesson 15
The terrible truth begins in a instructional activity that focuses on the final act of Sophocles' Oedipus the King. As ninth graders collect evidence that details the origin of Oedipus and how his birth relates to the prophecy everyone...
Curated OER
T3 Lesson Plan: Number 3
Sixth graders investigate local water. For this water cycle lesson, 6th graders take samples from surrounding water sources. Students record data from the samples, compare and graph the results.
Curated OER
Environmental Issues in Multimedia Presentation
Students investigate a community environmental issue. They document it using traditional scientific methods, digital photography, and videotaping. After collecting data, they graph the results. Students present their findings in a...
Curated OER
How to Graph in Excel
Fourth graders construct data graphs on the Microsoft Excel program. In this statistics instructional activity, 4th graders formulate questions and collect data. Students represent their results by using Excel.
Curated OER
Beginning Graphs in MS Excel
Students practice creating graphs in Microsoft Excel. In this technology lesson, students conduct a random survey and collect data. Students use the Microsoft Excel program to create a bar graph of the data.
Curated OER
Media in Research Multimedia Final Project
Students work cooperatively in groups to research a topic of their choice. They create a multimedia presentation of the information researched. Throughout the project they generate their own progress journals.
Intel
Forensics: Get a Clue
Although the methods are all scientific, forensic science was started by police officers rather than scientists, who relied on observation and common sense. Young detectives use many tools to solve crimes around the school in a...
Curated OER
Don't Trash the Earth
Students experience a hands-on environmental science project. They access about recycling as they collect data on their own family's trash production. Students analyze the data with worksheets, chart the data, and present their findings.
Curated OER
Data From Interviews
Students create and conduct a survey about favorite foods, gather and represent the data, interpret data and make predictions to present to the class. They create and use interview questions to gather data. Pupils are explained that...
Curated OER
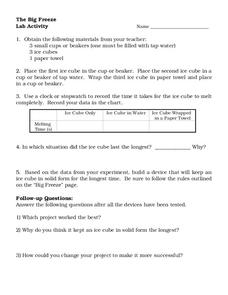
The Big Freeze
For this lab activity worksheet, students record the time it takes for an ice cube to melt in three different situations. After collecting data they design a container that will keep an ice cube in a solid state for as long as possible.
Curated OER
Significant Science: Statistics for Planet Earth
Ninth graders discover how statistics are used to interpret results of scientific experiments. Students write hypotheses and test the hypotheses by collecting data and organizing the data. Students graph their data to produce a visual....
Curated OER
Types of Data
In this data chart activity, learners read the directions and study the examples to learn the difference between qualitative, quantitative, discrete and continuous data. Students answer 24 questions. This page is intended to be an online...
Curated OER
Designing the Experiment and Answering the Question
Students investigate scientific methods by analyzing an article from the Natural Inquirer. In this data analysis lesson plan, students read an article from the magazine and discuss at least 2 scientific methods that could be used to...


