Curated OER
Collect Data Using a Transect Line
Middle schoolers learn about transect lines through a study of marine debris. In this marine debris lesson, students calculate the items on a transect line and graph them. Middle schoolers complete a category worksheet.
Kenan Fellows
Absorbance Curves: Using Spectrophotometers to Quantize the Effects of a Strong Acid on a Buffer
The Henderson-Hasselbalch equation combined logarithmic terms with the application of carbonic acid as a buffer solution. Scholars learn investigate equation and its applications through hands-on experiments. They collect data and...
Curated OER
Solar Kit Lesson #8 - Positioning Solar Panels II: Explorations with Stationary Panels
This lesson plan is preparation-intensive, but well worth the investment. You will construct five or six portable testing stations with which lab groups will gather data on the best position for collecting sunlight with a solar panel....
Curated OER
M&M Science and Math
A series of math and science activities feature M&M's® as manipulatives to help kids work through equations. The resource includes exercises on finding averages, percent of compositions, moles in chemical reactions, genotypes and...
Odyssey of the Mind
Odyssey of the Mind Curriculum Activity: HEALTHY HUMOR
This lesson is hilarious! To understand how to investigate a topic, collect data, and evaluate the results, learners research the effects of laughter on health. Each group is assigned a research task, which they will turn into...
Virginia Department of Education
Molar Heat of Fusion for Water
How can you describe heat of fusion in a way the class understands and relates the importance of this concept to present day issues? In this third lesson of the series, learners conduct an experiment, demonstrating the flow of heat...
Curated OER
Gathering Statistics for Research
Learners gather statistics to include in their research. In this statistics lesson, students investigate how to incorporate statistics into research and other readings besides math. They collect data based on other topics, analyze the...
NASA
The Invisible Sun: How Hot Is It?
It's getting hot in here! The first in a series of six lessons has learners model nuclear fusion with a simple lab investigation. Groups collect data and analyze results, comparing their models to the actual process along the way.
Perkins School for the Blind
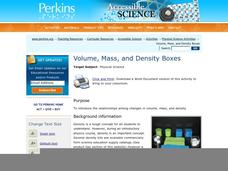
Volume, Mass, and Density Boxes
Mass and density are difficult topics for kids to understand, and even more difficult when you have visual impairments or blindness. Learners will make boxes and fill them with cotton, sand, or crushed paper. They will feel the density...
Curated OER
Egg Hunt
Middle schoolers make detailed qualitative and quantitative observations. They are introduced to the process of developing repeatable procedures. Students practice collecting data. They review measurement skills. Middle schoolers...
Curated OER
Probability and Expected Value
Students collect data and analyze it. In this statistics lesson, students make predictions using different outcomes of trials.
Howard Hughes Medical Institute
Survival of the Fittest - Variations in the Clam Species Clamys sweetus
It's not often that you come across a clever laboratory activity that is both imaginative and comprehensive! Using M&M's and Reese's peanut butter candies to represent two different clam species, young biologists test for "relative...
Intel
Forensics: Get a Clue
Although the methods are all scientific, forensic science was started by police officers rather than scientists, who relied on observation and common sense. Young detectives use many tools to solve crimes around the school in a...
University of Georgia
Using Freezing-Point Depression to Find Molecular Weight
Explore the mathematical relationship between a solvent and solute. Learners use technology to measure the cooling patterns of a solvent with varying concentrations of solute. Through an analysis of the data, pupils realize that the rate...
NASA
Discovering the Milky Way
What do you call a tiny collection of galaxies? A puny-verse! Young scholars graph data gathered by scientists studying Cepheids. They attempt to identify a relationship between the variables through standard and logarithmical graphing....
Chicago Botanic Garden
Weather or Not
What is the difference between weather and climate? This is the focus question of a lesson that takes a deeper look at how weather data helps determine climate in a region. Using weather and climate cards, students decide if a statement...
Curated OER
Analytical Problem Solving
Students explore about propagation of error in calculations using experimental data. They develop their weighing and pipetting techniques. Students explore the following terms: Standard deviation and relative standard deviatin. They...
Curated OER
The Hot Dog Stand
Students run a computer simulation. They collect data as they work and use the data to create an annual report for their business. Several different simulations could be used for this project. It is desirable for students to do this...
Curated OER
Making Numbers Manageable
Eighth graders recognize and express numbers when written in time saving techniques. They gather data from a variety of sources, including print and electronic media. They develop a presentation using a variety of techniques.
Curated OER
Strange New Planet
Fourth graders gather data and simulate a Mars spacecraft mission using multi-sensory observations.
Curated OER
Spaghetti Graphs
Learners work in pairs to test the strength of spaghetti strands. They collect and graph data to determine a line of best fit. Students create a linear equation to interpret their data. Based on the data collected, learners predict...
Curated OER
Earthquake Epicenter
Students use chart data to determine the location of the epicenter of an earthquake. This task assesses students' abilities to generalize and infer, organize data, interpret data, and apply mathematical concepts.
Statistics Education Web
Double Stuffed?
True or false — Double Stuf Oreos always contain twice as much cream as regular Oreos. Scholars first measure the masses of the filling in regular Oreos and Double Stuf Oreos to generate a class set of data. They use hypothesis testing...
PBS
Terrific Trees
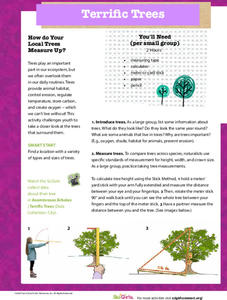
Engage in a shady activity to practice measurement techniques. Classes venture outside to collect measurements of various trees, using different strategies to measure the height, trunk circumference, width, and crown size. Then they...


