Curated OER
Prairie Restoration and Prairie Ecology
Students collect data as they identify and classify native prairie plants and insects. They create their own population study using a variety of sampling techniques to determine the population density of various species. Students...
Curated OER
Measuring Rainfall and Relationships Between pH, Alkalinity and Suspended Solids in the Pago River
Eleventh graders test the pH and alkalinity of Pago River. In this ecology lesson plan, 11th graders collect data and use spreadsheet to graph results. They analyze and share their findings with the class.
Curated OER
Insect Monitoring
Students practice the scientific method in the classroom, either in preparation or as a substitution for real-world field experience. They examine a simulated biodiversity research situation, using a "mini-plot" or
sampling square...
Curated OER
The Apple Orchard Problem
Students explore various approaches to solving a problem of maximizing the total production of apples in an orchard. In this apple orchard lesson, students collect data in order to solve the apple orchard problem presented. Students plot...
Curated OER
Biological and Agricultural Engineering
Eighth graders explore mathematics by conducting a series of investigations using a colorimeter. In this math lesson, 8th graders explain the purpose of food irradiation. They collect data and graph them.
Curated OER
What Is the Nature of Science?
Students distinguish between scientific and everyday meanings of key words-theory, hypothesis, law, fact-and use in context. They recognize the variables that affect observation, data collection, and interpretation. They discover the...
Curated OER
Classroom Meteorologists: An Experiential Approach to Learning about Seasons and Weather
Students examine several concepts about weather in the seven lessons of this unit. This year long activity helps students to gather data seasonally about wind, clouds, precipitation, and temperature. Earth's three climate zones are...
Discovery Education
Sonar & Echolocation
A well-designed, comprehensive, and attractive slide show supports direct instruction on how sonar and echolocation work. Contained within the slides are links to interactive websites and instructions for using apps on a mobile device to...
University of Georgia
Endothermic and Exothermic Reactions
Equip your chemistry class with the tools to properly understand endothermic and exothermic reactions. Young chemists collect, analyze, and graph data to determine how the Law of Conservation of Matter is applied to chemical composition...
Curated OER
The Extraverted Sensing Personality Type: An Introduction
Curriculum approaches and techniques that tantalize extraverted sensors.
National Wildlife Federation
What is DBH?
When measuring the circumference of a tree, does it matter how high you place the measuring tape? Most scholars have never considered this question, but scientists know that measurement techniques must be standardized. The 13th...
Curated OER
Graphing Data from the Chemistry Laboratory
Students graph and analyze data using a spreadsheet.
Curated OER
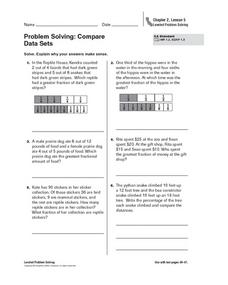
Problem Solving: Compare Data Sets
There are a variety of techniques students can use to compare fractions. In this worksheet on fractions, 5th graders are shown a way to create a visual comparison and asked to solve word problems. Students are encouraged to draw a...
Curated OER
Descriptive Statistics
Students demonstrate how to use frequency and scatter diagrams. In this statistics lesson, students are introduced to different techniques of representing data. Students sort and graph data on a worksheet and use a frequency diagram to...
Curated OER
Personal Collecting
Students attempt to form a collection of actual objects or research from a variety of sources. They write a formal proposal for the contents of the collection before beginning.
Curated OER
Asthma Survey
Learners collect survey data on the prevalence of asthma in a community. They summarize and display the survey data in ways that show meaning.
Curated OER
By Land, Sea or Air
Learners learn navigational techniques change when people travel to different places. They understand differences between navigation on land, water, air and in space. They explain the concept of dead reckoning as it applies to...
Curated OER
Water: From Neglect to Respect
The goal of this collection of lessons is to make middle schoolers more aware of the ways in which they are dependent upon water to maintain their standard of living. Learners compare water use in Lesotho to water use in the United...
Virginia Department of Education
Properties of Compounds and Chemical Formulas
Young chemists have unknown compounds they need to sort. Performing three different tests on each, the chemical behaviors they observe become the basis for data analysis.
Curated OER
China: Land Beyond the Wall
An excellent series of five lessons on China awaits you and your young geographers. In these lessons, learners engage in hands-on activities, watch streamed video, access websites, and complete activities in cooperative groups in order...
Curated OER
How Long Can You Go?
Eighth graders examine the usefulness of a line of best fit by collecting and graphing data, using a graphing calculator to determine the line of best fit, and making a variety of predictions. They watch a video, then design a...
Statistics Education Web
It’s Elemental! Sampling from the Periodic Table
How random is random? Demonstrate the different random sampling methods using a hands-on activity. Pupils use various sampling techniques to choose a random sample of elements from the periodic table. They use the different samples to...
Curated OER
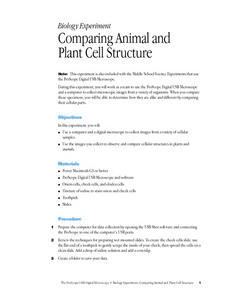
Comparing Animal and Plant Cell Structure
High schoolers work as a team to use the ProScope Digital USB Microscope and a computer to collect microscopic images from a variety of organisms. When they compare these specimens, they are able to determine how they are alike and...
Curated OER
Half Life Lab
Seventh graders model radioactive decay using pennies, collect data from their model, apply scientific visualization techniques to their data and create animated models explaining the concept of radioactive half-life.


