Curated OER
China: Land Beyond the Wall
An excellent series of five lessons on China awaits you and your young geographers. In these lessons, learners engage in hands-on activities, watch streamed video, access websites, and complete activities in cooperative groups in order...
Curated OER
How Long Can You Go?
Eighth graders examine the usefulness of a line of best fit by collecting and graphing data, using a graphing calculator to determine the line of best fit, and making a variety of predictions. They watch a video, then design a...
Statistics Education Web
It’s Elemental! Sampling from the Periodic Table
How random is random? Demonstrate the different random sampling methods using a hands-on activity. Pupils use various sampling techniques to choose a random sample of elements from the periodic table. They use the different samples to...
Curated OER
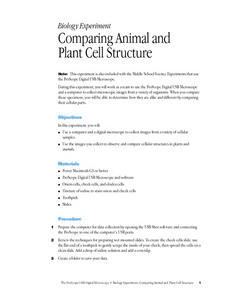
Comparing Animal and Plant Cell Structure
High schoolers work as a team to use the ProScope Digital USB Microscope and a computer to collect microscopic images from a variety of organisms. When they compare these specimens, they are able to determine how they are alike and...
Curated OER
Half Life Lab
Seventh graders model radioactive decay using pennies, collect data from their model, apply scientific visualization techniques to their data and create animated models explaining the concept of radioactive half-life.
Curated OER
Why Is A City Located Where It Is?
Young scholars analyze how transportation influenced the development of Stillwater, Minnesota, They use the same techniques to analyze the impact of transportation on the origination and development of their own community.
Curated OER
What To Do After The Hands-Are-On
Students perform various demonstrations for each of Newton's Laws, collect data, and write a conclusion for each.
Curated OER
The Kangaroo Conundrum: A Study of a Quadratic Function
Students play a game and collect data for their graph. In this algebra lesson, students solve quadratic equations and identify properties of their graph. They describe the pattern created by the graph and the game.
Curated OER
Which Household Cleaners or Soaps Work Best Against Bacteria?
Students experiment to determine the efficacy of various household cleaning products and soaps as antibacterial agents. They work in groups to complete this four part lesson series which includes identifying household bacteria,...
Curated OER
Friction Force
High schoolers investigate friction force on a variety of objects such as bricks and cardboard boxes. They use a force probe to collect data on the changes in force required to drag the objects across a variety of surface types.
Curated OER
Can you Find the Expression
Students collect data from measurements and weights for this experiment. In this algebra lesson, students analyze graphs they create form their data to find the expression representing the data. They label which graph provided the best...
Curated OER
Animal Trackers
Students use space technology to monitor migratory species, map their movements, and gather data about their habitats and possible responses to climatic shifts.
Curated OER
Territorial Behavior in Crickets
Students explore the behavior of crickets during courtship. They measure the number and types of interactions between household crickets. Students discriminate between quantitative and qualitative observations. They collect data to...
Curated OER
Stimulus/Response in Invertebrates
Students design and conduct and experiment to determine how invertebrates react to an outside stimulus such as light and other stimuli. Student must develop a clear plan of action, collect data in an organized manner and analyze their...
American Psychological Association
Counting Fidgets: Teaching the Complexity of Naturalistic Observation
Why do psychologists conduct experiments in controlled laboratory settings? High schoolers gain an understanding of the importance of controls with an activity that involves naturalistic observations with no imposed controls.
Curated OER
M&M Graphing
Youngsters sort M & M's by color. They graph the M&M's by color on a graph. This classic lesson is a wonderful way to introduce the concept and technique of graphing to young mathematicians. Pairs of kids can make up their own...
Curated OER
Ratio and Probability
Fifth graders investigate the mathematical concepts of ratio and probability using created spinners and data collection techniques in this Math lesson for the fifth grade classroom. This lesson can be accomplished as an individual or...
Curated OER
Linking Algebra to Temperature
Students convert between two units as they calculate the temperature. In this algebra lesson, students collect data on seasonal climate and create a graph. They make conjectures based on their data collection.
Curated OER
Using Concept Maps to Design 3D Spheres
High schoolers create three dimensional shapes using concept maps. In this geometry lesson, students investigate the impact of mental schemas on humans. They collect data on this topic and plot their data on a coordinate plane.
Curated OER
Separation of Unknowns in a Liquid
Learners identify the different components of a given sample using chromatography. In this chemistry lesson, students compare paper and column chromatography. They collect data and construct data tables.
Curated OER
That's the Way the Ball Bounces
Students investigate and compare the bouncing ability of the materials from which four different balls are made. They determine which material performs the best for use as a basketball. After collecting data in a small group they...
Curated OER
The Desert Biome
Students create a visual presentation of the characteristics of a biome. Working in small groups, students use traditional and online resources to gather data concerning biomes. Students use their information to create a bulletin board...
Curated OER
Impact Craters
Students investigate the factors affecting the size of a crater. In this space science lesson, students collect data from the activity and graph them. They explain how velocity of impact relate to crater size.
Curated OER
Math:Survey Role-Playing Activity
Learners create survey questions to discover why students join clubs. Using sampling methods and question phrasing techniques, they conduct the survey both in and out of school. Once learners analyze their survey information, they...


