Curated OER
The Golden Students
Scholars view the video, "Donald Duck in Mathmagic Land," and discuss examples in nature which have proportions of the golden ratio. They measure and record different body lengths from a worksheet and convert the ratios to equivalent...
NOAA
A Quest for Anomalies
Sometimes scientists learn more from unexpected findings than from routine analysis! Junior oceanographers dive deep to explore hydrothermal vent communities in the fourth lesson in a series of five. Scholars examine data and look for...
NASA
Newton Car
If a car gets heavier, it goes farther? By running an activity several times, teams experience Newton's Second Law of Motion. The teams vary the amount of weight they catapult off a wooden block car and record the distance the car...
Federal Reserve Bank
Cash Flow and Balance Sheets
What is your car worth? How much do you owe? Individuals create their personal cash flow and balance sheets. They learn the difference between an asset and liability using their personal information to complete the activity.
Space Awareness
Greenhouse Effect
A greenhouse provides additional warmth and protection to the plants inside, but what if the greenhouse gets too hot? Pupils discuss and experiment with the difference between natural and anthropogenic greenhouse effect. They measure the...
Purdue University
Getting the Dirt on Decomposition
Sometimes science requires getting a little dirty. A hands-on activity explores the idea of decomposition by building a compost structure. Using red worms and dirt, individuals build and collect data on the rate of decomposition. The...
University of Minnesota
Makes Me Sweat
Never let them see you sweat ... unless you can't help it! Scholars design an experiment to determine the effects of stress on the body. They monitor sweat production under different conditions and relate the response to the function of...
K20 LEARN
Transpiring Trees: Plant Transpiration and the Water Cycle
Looking for a tree-rific addition to your water cycle unit? Teams of young foresters examine the role of transpiration in the water cycle through a week's worth of activities. Pupils analyze how trees take in and transport water during...
Alabama Wildlife Federation
Big Fish, Little Fish
Tag, you're eaten! A instructional activity on predator-prey relationships uses the game freeze tag as a model. Learners become either a predator or prey and play a game of tag as the prey tries to reach areas that house food and...
Curated OER
Coral Snapshots
Using photographs and a coral reef identification key, junior marine biologists compare changes in coral cover for a No-Take Area and the surrounding unprotected area. The data that is collected is then analyzed for richness,...
WindWise Education
Which Blades Are Best?
If I change the length, will they work better? After brainstorming the variables of wind turbine blade design, groups choose one variable to isolate and test. The groups then present their data to the class in order for all to have the...
EngageNY
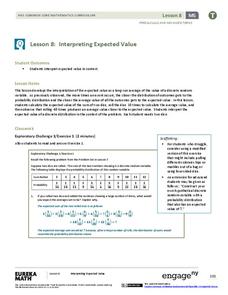
Interpreting Expected Value
Investigate expected value as a long-run average. The eighth installment of a 21-part module has scholars rolling pairs of dice to determine the average sum. They find aggregate data by working in groups and interpret expected value as...
Beyond Benign
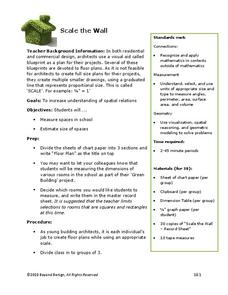
Scale the Wall
How can you fit an entire school on one sheet of paper? You use scale! Scholars measure rooms in the school and, using the correct scale, design a floor plan that includes area calculations with their data.
Curated OER
Ketchup to Collecting Data
First graders collect data for a survey of 3 brands of ketchup and create class charts. They taste test three different brands of ketchup, and use the data to create a presentation. Tasty lesson!
Curated OER
Grade 1: More Land or Water?
First graders listen as the teacher reads a story involving cross-continent traveling. Students collect a random sample by tossing an inflatable globe and recording whether they touch land or water each time they catch the globe in order...
Curated OER
Creating a Graph
Students brainstorm favorite things to do during the summer. They survey classmates to collect data, arrange it in a chart, and create graphs using ClarisWorks.
Curated OER
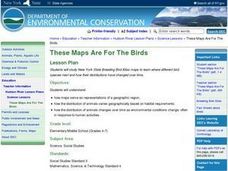
These Maps are for the Birds
Students identify and study New York State Breeding Bird Atlas maps to learn where different bird species nest and how their distributions have changed over time. They also identify how maps serve as representations of a geographic...
Curated OER
Observations (collecting data)
Students observe and collect data about the earthworm. In this observation of an earthworm lesson plan, students use an earthworm to determine the effects of light and incline on the earthworm's behavior. They practice making...
Curated OER
The Life Cycle of the Mealworm
Fourth graders provide a habitat for live mealworms and observe their life cycle. In this animal life cycle and scientific inquiry lesson plan, 4th graders create a habitat for a live mealworm and observe and record related data as it...
Curated OER
Osmosis and the Cell Membrane-part 2
Young scholars participate in a review of diffusion and the basic properties of the cell membrane before exploring the process of osmosis in a lab activity. Using shell-less eggs that have soaked in various solutions, students make...
Curated OER
Observing the Evidence
Fifth graders explore how to do research from a large group. They explore how to choose a representative sample and collect data from it.
Curated OER
Effects of Temperature, Deviation on Climate
Young scholars collect and record data for a given city. They calculate standard deviation of temperature and analyze the impact of climate changes on a city's and culture.
Curated OER
Plastic Packaging
Students collect data. In this math instructional activity, students collect data about recyclable materials. Students develop a plan that will help the environment. Recycling plastic containers is discussed.
Curated OER
Risk Assessment and Geometry
Tenth graders study the concept of risk analysis as it relates to geometry. For this spatial relationship lesson, 10th graders are provided a set of coordinates to analyze a piece of land described. Students write a description that...


