Curated OER
The Reasons for the Seasons
Sixth graders conduct a controlled investigation to determine the length of the sun's shadow on a fixed object (i.e., flagpole, telephone pole, etc.) over a three-day period (one day in the fall, one in the winter, and one in the...
Curated OER
The Internet Pizza Server - Creating Your Own Pizza
Students create their own pizza, "order" it from the Internet, and see digitized versions. They calculate the area of various size pizzas in order to do cost analysis to determine best buys.
Curated OER
Graph It with Coffee!
Young scholars interview employers and employees at local coffee shops about sales and profits and create graphs comparing and contrasting information obtained about the businesses.
Curated OER
Creating Circles
Learners make a circle graph. In this graphing lesson, the teacher conducts a class survey, then demonstrates how to make a pie graph. When students are comfortable with the material, they use a worksheet to create their own graph.
Curated OER
Weather Tracking
Second graders use the internet to locate weather reports. They present data collected to the class through poster presentation. They read aloud the book Cloudy with a Chance of Meatballs by Judi Barrett and answer questions about...
Curated OER
Beans and Birds: A Natural Selection Simulation
Young scholars solve the following problem concerning the evolution of seed color in pinto bean plants: "How does natural selection change the frequency of genes or traits over many generations?" They use the constructivist approach to...
Curated OER
What is That White Stuff?
Fifth graders identify, through experimentation, what properties of substance are, determine what variables tested will be, identify constants and variables of experiment, conduct experiment to conclusion with measurable, recorded...
Curated OER
Gummy Bear Picture Graph
First graders investigate picture graphs. In this graphing instructional activity, 1st graders create a picture graph with the x-axis being number and the y-axis being color. Students sort their gummy bears by color and use pictures of...
Curated OER
Collecting Data and Graphing
Young scholars practice collecting and graphing data using interlocking cubes. In this graphing lesson plan, partners count cubes and graph them. They also use a meter stick to measure arm span and height then compare the results with...
Curated OER
Computer Graphing
Students research the Internet or create surveys to find graphable data. They collect, organize, analyze and interpret the data. Finally, they choose the appropriate type of graph to display the data and find the measures of central...
Curated OER
Entrance Ticket
Students collect data on different events and word problems. In this algebra lesson, students use a table to organize their data. They graph their coordinate pairs on a coordinate plane and make predictions.
Pennsylvania Department of Education
Adding and Subtracting Three-Digit Numbers by Jumping
Second graders use data to graph information and draw conclusions. In this instructional activity on data analysis, 2nd graders practice gathering, sorting, comparing, and graphing data. Students differentiate data that can and cannot...
Curated OER
Activity Plan 5-6: What's In a Name?
Students use family names to gather and analyze data. For this counting lesson, students use graph paper to help organize their data and then, in a staircase fashion, organize the names from longest to shortest so they can answer...
Curated OER
Weather Station Report
In this science worksheet, middle schoolers fill out the data report for the seven different questions. The focus is upon the interpretation of data.
Curated OER
Weather Instrument Data Chart
In this science worksheet, students look for the answers to the correct place on the data chart. They organize and make interpretations of the data.
Curated OER
Countdown to Disaster
Students discover the potential dangers of weather in their hometown. In this environmental lesson, students research Hurricane Hugo and the devastation it caused South Carolina in 1989. Students record weather data from their city and...
Curated OER
This is the Way We Go To School
Second graders create and utilize a graph using the Excel computer program. They gather data regarding how the students get to school, tally the numbers for the class, and create a bar graph on paper and using Excel.
Curated OER
El Nino Lesson
Students compare graphs of weather occurrences. In this environmental lesson plan, students will being using the website to gather weather related information for a certain time period. The students will then graph the data that will be...
Curated OER
Coming to America: U.S. Immigration
Analyze primary source documents relating the conditions under with prompted American immigration. Learners will analyze information in order to create a six-panel pamphlet. Much of the lesson is not available but the key objectives are....
Curated OER
Blast the Fats
Students examine the fats found in foods. In this nutrition lesson, students identify the types and amounts of fats found in foods as they research food labels and the Internet. Students classify the fats and record their data.
Curated OER
How Caves Are Formed
Young scholars explore caves. In this cave formation lesson, students take a virtual tour of a cave and then participate in a scientific investigation that requires them to grow crystals and chart data regarding their growth.
Curated OER
And You Thought Gasoline Was Expensive!
Students carry out a cost analysis. For this comparative math lesson, students compare the cost of equal measures of gasoline to mouthwash, house paint, fruit juice, white-out, and other liquids.
Southern Nevada Regional Professional Development Program
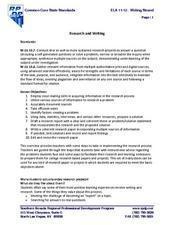
Researching and Writing
Designed for teachers, this resource identifies problems learners face when attempting a research project and approaches instructors can use to help their class members overcome these obstacles. Suggestions are included for how to help...
Curated OER
Viewing Tubes
Students complete a lab in order to discover if the length of a viewing tube, its diameter, or the distance from an object affect the type of data collected and the resulting graph.


