Curated OER
The Codex Comes Home: Leonardo Lives in Seattle
Students complete a unit on the life of Leonardo da Vinci and the content of the Codex Leicester. They write an encyclopedia entry, watch a film, complete a data sheet, conduct Internet research, and write a letter to Bill Gates about...
Curated OER
Pyramid of Biomass
Students interpret data to demonstrate biomass and number pyramids. They use information to draw conclusions and examine an example of biological magnification.
Curated OER
Fossils And Migration Patterns in Early Hominids
Students plot the general distribution of major fossil hominid taxa on a small black and white world map using data provided. They infer a continent of origin and likely path of migration using a worksheet guide and small group discussion.
Curated OER
What's a Per-"cent"?
Students recognize the mathematical connections between fractions and percents. They develop and study graphs to make connections between their data and what it represents. They write about the connections they have discovered.
Texas Instruments
Golden Ratio Lab
Learners investigate the Golden Ratio in this algebra I or geometry lesson. They explore the Golden Ratio as the conduct an experiment in which they collect various measurement from their team members and find the regression equations...
Curated OER
Computer Interfacing: Frequency Measurement - The Doppler Effect
Students explore the Dollper effect by finding the frequency and velocity of sound. In this velocity lesson, students determine the impulse during a collision by using their data and a software program.
Curated OER
My Bank, My Budget, My Decisions
Students create a personal budget. In this financial planning lesson, students create a budget using income data and identify ways to save a portion of money for donations.
Curated OER
Recipe: Unit Rate
Students solve problems using ratios and proportions. In this algebra lesson, students identify the unit rate and convert between fractions and decimals. They create graphs from their data.
Curated OER
Proportionality in Tables, Graphs, and Equations
Students create different methods to analyze their data. In this algebra lesson, students differentiate between proportion and non-proportional graph. They use the TI-Navigator to create the graphs and move them around to make their...
Curated OER
Dynagraphs
Students collect and graph their data. In this precalculus lesson, students identify the input and out of a function. They find the domain and range and the inverse of a function.
Curated OER
Multiply Boxplots
Students identify the mean, quartiles and range of a boxplot. In this statistics lesson, students identify cooperative boxplot as it relates to the data. They make conjectures about students grade distribution.
Curated OER
Percentiles
Students analyze the bell curve and make predictions. In this statistics lesson, students calculate the percentile to the left of the curve. They then are given the percentile and create the graph from the data.
Curated OER
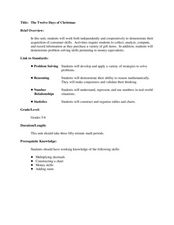
The Twelve Days of Christmas
Students purchase gift items and practice collecting, analyzing, computing, and recording information. In this data lesson plan, students also complete money equivalent activities.
Baylor College
Needs of Plants
What better way to learn about plant life than by creating a class garden? Young botanists start with a brief discussion about radishes before planting seeds and watching them grow. To determine the importance of water, sunlight, and...
Chicago Botanic Garden
Calculating Your Carbon Footprint
Unplugging from technology for one day per week will decrease your carbon footprint—are you up to the challenge? Part two in a series of three allows individuals to explore their personal carbon footprints. By first taking a quiz at home...
Texas Education Agency (TEA)
Architectural Lettering
And you thought you already knew how to write letters! Instructors demonstrate various techniques used in architectural lettering. Pupils then apply these techniques in a lettering exercise to complete the third lesson in the series of...
Cornell University
What Happens When We Excite Atoms and Molecules?
Excited atoms lead to exciting lessons! Learners use heat and light to excite both atoms and molecules. They display their learning in the form of Bohr models depicting the excited state of the atoms.
Kenan Fellows
Reaction Stoichiometry—How Can We Make Chalk?
What is a reasonable percent yield in the manufacturing process? Scholars develop a process for producing chalk in the third activity of a six-part series. Then, they must determine the theoretical and percent yield. Discussions about...
Curated OER
Graphing Data - Temperature
Seventh graders measure and record temperature over a given time period. They compare the recorded temperatures to the 40-year recorded normal average temperatures for the same area. Students display and interpret their findings in a graph.
Curated OER
Design Patterns in Everyday Life
Students find symbols and patterns in everyday life. In this patterns lesson, students break into groups and look for specific patterns and symbols. Students record their findings. Students create a graphic organizer with the information.
Curated OER
Survival
Students determine the best material from which to make a jacket to keep the body warm in a cold, dry, windy climate. This task assesses the student's abilities to perform an entire investigation.
Curated OER
If .... Then Probably
Students are introduced to the concepts of probability and chance. Using data given to them, they organize and create a chart to display the information. Using this chart, they calculate the percentage of chance and probability and...
Curated OER
"Publication" of Scientific Papers And Posters
Students create and display a scientific poster in the same format that scientists use at a research symposium. They compile data and make conclusions about the classification of the Arizona Hedgehog Cactus as an endangered species. ...
Curated OER
Algebra 2 - Linear Programming
Young scholars read real world problems, determine the variables, and set up the function using algebraic statements. After entering data into the graphing calculator, they display information in the form of graphs and scatter plots. ...
Other popular searches
- Misleading Data Display
- Appropriate Data Display
- Display Data
- Graphs and Data Display
- Display Simple Data
- Data Display Center
- Voluntary Data Display
- Best Data Display
- Data Display and Analysis
- Rates and Data Display
- Simulation Data Display
- Ways to Display Data


