Curated OER
Biodiversity and Ecosystems
Middle schoolers differentiate between biotic and abiotic factors in this science lesson. Learners collect data for the experiment and analyze the data after graphing it using the CBL 2. This experiment is split into two different...
Curated OER
The Disappearing Kelp Forest
Learners observe the effect "El Nino" left on kelp plants and sea urchins. They analyze the data collected by researchers, by graphing it on a TI calculator. Before graphing and analyzing the data, you may want to revisit the events of...
Curated OER
Health of Aquatic Life a Real Problem
Learners explore the health of aquatic life in this science lesson plan They measure and track the oxygen level in the water to determine the health of the aquatic life. They collect this data using the TI explorer to graph and analyze...
Curated OER
Curve Fitting
Pupils investigate linear, quadratic, and exponential regressions. They plot sets of data points, determine the regression equation that best fits the data and lastly investigate the coefficient of determination.
Curated OER
Charging Up, Charging Down
Learners collect and analyze voltage data. Then, they investigate exponential functions using the TI and a Voltage Probe and graph their data and analyze it using a table.
Curated OER
Tight Rope
Learn how to explore the concept of linear functions. In this linear functions lesson, learners collect linear data from a motion detector. Students walk to create a linear function. Learners plot the points on a graph...
Curated OER
Frequency, Histograms, Bar Graphs
In this statistics learning exercise, students plot and graph their data, then interpret the data using the correct form of graphs. There are 3 detailed questions with an answer key.
Curated OER
Fire Safety Survey
Students collect data regarding fire safety and create a graph. Working in small groups, they administer a survey to family and friends regarding their attitudes toward fire safety. After data has been gathered, students graph their...
Curated OER
Energy Content of Foods
Learners collect data, organize and analyze the data and compare it to real life scenarios. This assignment requires two class periods.
Curated OER
Let the River Run
Pupils examine deposits found in a river in this science lesson. They collect data of sediment deposit found in the Mississippi river, then graph and analyze their data using the TI.
Curated OER
TI Workshop Presentation Guide for "Preparing for Proofs"
Pupils discover proofs using the TI in this geometry activity. They collect data from newspaper and magazines and analyze their data using the TI, relating it to proofs.
Curated OER
Seven Up
Learners investigate the symbolism of the Seven Wonders of the Ancient World, and evaluate modern "wonders of the world." In small groups, they complete a data chart on a selected Wonder, create a poster from the data, and prepare a...
Texas Instruments
Can You Breathe Like a Pinniped?
Young learners compare the breathing patterns of different animals in this pinniped lesson. They examine the breathing pattern of California sea lions and northern elephant seals. Pupils collect, compare and analyze data concerning...
Curated OER
FCAT Real World Solving Linear Equations/Systems
Pupils relate real life situation to the equations, graphs and inequalities. They model real life scenarios using matrices and draw conclusions from their data. This lesson plan is aligned with FCAT.
Curated OER
Chill Out: How Hot Objects Cool
Teach how to explore exponential equations. In this Algebra II lesson, high schoolers investigate the graph that occurs as a hot liquid cools. Students model the data algebraically.
Texas Instruments
Math TODAY for TI-Navigator System - Is Leisure Time Really Shrinking?
High schoolers organize data from the USA TODAY Snapshot, "Is leisure time really shrinking?" into two scatter plots and determine the quadratic model for each scatter plot. They determine if these graphs intersect and learn the concept...
Curated OER
Change of State
Students investigate the change of states of Butyl Stearate and the temperatures at which it changes state. In this change of state lesson plan, students place a test tube of Butyl Stearate in a cold water bath and monitor its...
Curated OER
Water Conservation
Students identify ways to conserve water. In this environmental lesson, students use a water use checklist to identify how much water they use in one day. Students analyze the data and brainstorm ways to conserve water.
Curated OER
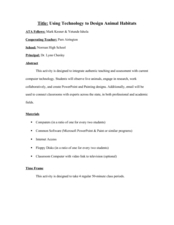
Using Technology to Design Animal Habitats
Students study the relationship between an animal and where it lives. In this habitats lesson students research to obtain data and create a professional report.
Curated OER
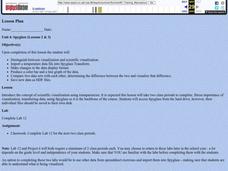
Spyglass
Students distinguish between visualization and scientific visualization. They use the software program Spygalss to create images from two-dimensional arrays of numbers.
Curated OER
Math Today - World Population Milestones
Pupils use the data from USA TODAY Snapshot "World population milestones" to explore and explain the trends in the world population.
Curated OER
Involving Community Members, Parents, and Community Agencies in Student Learning
Pupils predict and estimate the number of moose shot by people between the years of 1986-1990. They analyze data and statistics, construct bar graphs, and conduct research on the Alaskan moose.
National Security Agency
Are You Ready to Call the Guinness Book of Records?
Learners design questions that can be answered by collecting data. In this line-plot instructional activity, pupils collect data and graph on a line plot on world records. An abundant supply of teacher support is provided in this resource.
Curated OER
Can You Measure Up?
Here is a well-designed lesson on common standards of measurement for your young mathematicians. In it, learners calculate measurements in standard and non-standard units. They make predictions, record data, and construct and design...
Other popular searches
- Misleading Data Display
- Appropriate Data Display
- Display Data
- Graphs and Data Display
- Display Simple Data
- Data Display Center
- Voluntary Data Display
- Best Data Display
- Data Display and Analysis
- Rates and Data Display
- Simulation Data Display
- Ways to Display Data


