Texas Instruments
Can You Breathe Like a Pinniped?
Young learners compare the breathing patterns of different animals in this pinniped lesson. They examine the breathing pattern of California sea lions and northern elephant seals. Pupils collect, compare and analyze data concerning...
Curated OER
FCAT Real World Solving Linear Equations/Systems
Pupils relate real life situation to the equations, graphs and inequalities. They model real life scenarios using matrices and draw conclusions from their data. This lesson plan is aligned with FCAT.
Curated OER
Chill Out: How Hot Objects Cool
Teach how to explore exponential equations. In this Algebra II lesson, learners investigate the graph that occurs as a hot liquid cools. Students model the data algebraically.
Texas Instruments
Math TODAY for TI-Navigator System - Is Leisure Time Really Shrinking?
High schoolers organize data from the USA TODAY Snapshot, "Is leisure time really shrinking?" into two scatter plots and determine the quadratic model for each scatter plot. They determine if these graphs intersect and learn the concept...
Curated OER
Change of State
Students investigate the change of states of Butyl Stearate and the temperatures at which it changes state. In this change of state lesson plan, students place a test tube of Butyl Stearate in a cold water bath and monitor its...
Curated OER
Water Conservation
Young scholars identify ways to conserve water. For this environmental lesson, students use a water use checklist to identify how much water they use in one day. Young scholars analyze the data and brainstorm ways to conserve water.
Curated OER
Using Technology to Design Animal Habitats
Young scholars study the relationship between an animal and where it lives. In this habitats activity students research to obtain data and create a professional report.
Curated OER
Spyglass
Students distinguish between visualization and scientific visualization. They use the software program Spygalss to create images from two-dimensional arrays of numbers.
Curated OER
Math Today - World Population Milestones
Students use the data from USA TODAY Snapshot "World population milestones" to explore and explain the trends in the world population.
Curated OER
Involving Community Members, Parents, and Community Agencies in Student Learning
Students predict and estimate the number of moose shot by people between the years of 1986-1990. They analyze data and statistics, construct bar graphs, and conduct research on the Alaskan moose.
National Security Agency
Are You Ready to Call the Guinness Book of Records?
Learners design questions that can be answered by collecting data. In this line-plot lesson, pupils collect data and graph on a line plot on world records. An abundant supply of teacher support is provided in this resource.
Curated OER
Can You Measure Up?
Here is a well-designed lesson on common standards of measurement for your young mathematicians. In it, learners calculate measurements in standard and non-standard units. They make predictions, record data, and construct and design...
Curated OER
Project Geode
Young geologists attempt to predict the appearnace of a geode's internal structure based on how it looks from the outside, its mass, and its physical characteristics. In this geologly instructional activity, learners use scientific...
Curated OER
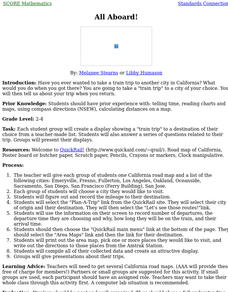
All Aboard!
Learners, in groups, create a display showing a "train trip" to a destination of their choice from a teacher-made list. They also answer a series of questions related to their trip. Groups present their displays.
Curated OER
Math Investigations 2
Young mathematicians practice measuring and graphing skills while working in groups to measure objects found in the classroom. Using their measurements, they create one bar graph displaying the lengths and another displaying the widths.
Curated OER
Investigating Factors That Affect Cell Membrane Permeability
Cell membranes and the factors that affect its integrity are studied, with Beet tissue used as the model. A poster to display findings of the permeability of the membranes would clarify understanding and also allow a layer of language...
Virginia Department of Education
Atomic Structure: Periodic Table
The fifth lesson of seven in the series outlines an in-depth analysis of the periodic table. After direct instruction, pupils take turns practicing in the group before beginning independent study. The assessments include a quiz and an...
Curated OER
Butterflies, Butterflies, Butterflies
Transform your class into a butterfly museum! Research different types of butterflies, their habitat, and life cycle. Interactive components such as PowerPoint presentations, Claymation movies, and webpages add pizzaz to the museum...
Curated OER
Catalytic Converter
Two animated slides explain the decomposition reactions that occurs within a catalytic converter. An enthalpy diagram is displayed. Hess's Law is demonstrated. Finally, the analogy of football is used to explain Hess's Law. This clever...
NASA
NASA
Everything you have ever wanted to know about our solar system, space exploration, and more can be found here. Be prepared to clear your schedule; you will be sucked into the app like a star into a black hole.
Curated OER
Show Me The Money
Third graders explore the value of U.S. money. In this money lesson, 3rd graders print out pictures of money from the Internet and create play money. The students will play a game in which they display the amount of money called out by...
Curated OER
Saving Energy Through Ecological Landscape Design
Students are able to transcribe to scale the plant features of a common landscape. They determine true north and south and collect and record data on a table. Students calculate a rating for and describe a definition of insulation and...
Curated OER
Measuring Mania
Students rotate through stations in the classroom, completing different types of measurements. These measurements are placed into a spreadsheet, and a scatter plot is generated. They type an explanation of their results in correlation...
Curated OER
Hurricanes in History:
Students interpret data displayed in a graph, make inferences based on graphical data. They work in pairs or groups to interpret graphs containing historical data of hurricanes, and then answer questions that assess their understanding...
Other popular searches
- Misleading Data Display
- Appropriate Data Display
- Display Data
- Graphs and Data Display
- Display Simple Data
- Data Display Center
- Voluntary Data Display
- Best Data Display
- Data Display and Analysis
- Rates and Data Display
- Simulation Data Display
- Ways to Display Data


