Project SMART
Exploring the History of Mathematics
Students research six different mathematicians using Internet resources. They examine the contributions of different cultures, women, and one that made a significant to geometry. They present their research to the class.
Curated OER
Surveys
Students collect data from middle school survery. They tabulate percentages by grade level. They create a graph to display the survey results.
Curated OER
3 Kinds of Graphs
Students construct three different graphs-a line graph, a bar graph, and a circle graph. In this graphing instructional activity, students use different graphs to display various data that they collect.
Curated OER
Collecting Data and Graphing
Eighth graders, in groups, count the different colors of M&M's in each kind of package and then draw a pictograph to show the results. Each group writes a program to show their results and then compare the manually-drawn and computer...
Curated OER
Upwelling - Cold One Day, Warm Another?
Discuss with your oceanographers what forces cause nearshore upwelling and downwelling. Display a line of wind vectors alongside a graph of the temperatures so that they can discover whether or not they are related. Discussion questions...
Curated OER
The Nifty Fifty- Facts and Figures
Students explore an assigned state. In this United States geography lesson, students identify facts and figures related to a particular state. Students use the Internet for research and create a PowerPoint presentation displaying these...
Curated OER
Hurricanes in History:
Students interpret data displayed in a graph, make inferences based on graphical data. They work in pairs or groups to interpret graphs containing historical data of hurricanes, and then answer questions that assess their understanding...
Curated OER
Snack Attack
Students design charts, tables, graphs, and pictographs to analyse the types of snacks in a bag.
Curated OER
When Dinosaurs Ruled the World
Students graph the varying sizes of dinosaurs. In this math and dinosaur lesson, students view dinosaur models and compare the different shapes and sizes of the dinosaurs. Students complete a dinosaur math activity, read The Dinosaur...
Curated OER
The Solar Cycle
Students research the solar cycle. In this Science lesson, students use the internet to investigate the solar cycle. Students produce a spreadsheet and graph from the information collected.
Curated OER
Applied Science - Science and Math Lab
Students make a prediction. In this applied science instructional activity, students guess the number of items in a jar. Students create a bar graph to show the predictions and the actual amounts.
Curated OER
Twentieth Century Entertainment: When Work is Done
Students determine how Americans enjoy leisure time. In this 20th century America lesson, students research primary sources to study how Americans gained leisure time during the century and what they did with it.
Curated OER
Bouncing off the Walls
Third graders compare the bouncing height of different types of balls. In this science lesson, 3rd graders explain the importance of repeated experimentation in science. They record their result and share them with the class.
Curated OER
Hopes and Dreams: A Spreadsheet Lesson Using Excel
Fourth graders read "The Far Away Drawer" by Harriet Diller and discuss the story as a class. After discussion, 4th graders create a t-shirt GLYPH about their hopes and dreams,share their information with the class and create spreadsheets.
EngageNY
Informally Fitting a Line
Discover how trend lines can be useful in understanding relationships between variables with a lesson that covers how to informally fit a trend line to model a relationship given in a scatter plot. Scholars use the trend line to make...
University of Colorado
The Moons of Jupiter
Can you name the three planets with rings in our solar system? Everyone knows Saturn, many know Uranus, but most people are surprised to learn that Jupiter also has a ring. The third in a series of six teaches pupils what is around...
Curated OER
Science: Her-bariums Galore!
Young scholars collect and identify plant species and construct herbariums both at school and at home. By gathering data from both locales, they draw conclusions and make predictions about plant diversity. Upon completion of the...
University of Colorado
Happy Landings: A Splash or a Splat?
Huygens spacecraft landed on Saturn's moon Titan in 2005, making it the farthest landing from Earth ever made by a spacecraft. In this hands-on activity, the 12th installment of 22, groups explore how density affects speed. To do this,...
Curated OER
Changing Planet: The Warming of Our Large Lakes - Reasons for Concern
Another A+ instructional activity on the impact of climate change comes to you from the National Earth Science Teachers Association. In this installment, learners model the stratification of water in lakes due to temperature differences....
University of California
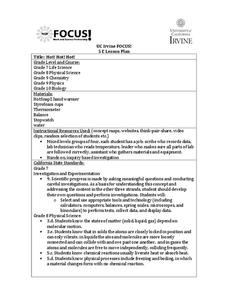
Hot! Hot! Hot!
Calories are not tiny creatures that sew your clothes tighter every night, but what are they? A science activity, presented at multiple levels, has learners experiment with heat, heat transfer, and graph the function over time. It also...
Curated OER
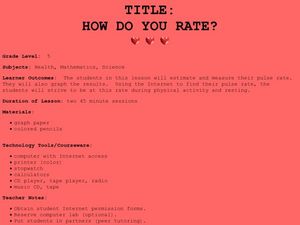
How Do You Rate?
Fifth graders make a graph. For this pulse rate lesson, 5th graders estimate their pulse and record it. Students measure their pulse while at rest and after physical activity and record it. Students use the internet to graph their...
Curated OER
Weather "Whys"
Students complete activities to explore fall weather. In this weather lesson, students use the given links to examine weather forecasts. Students complete a weather graph activity and watch Internet field trips. Students complete fall...
Science Matters
Slip Sliding Along
The San Andreas Fault is the largest earthquake-producing fault in California. In the seventh lesson in the 20 part series, pupils create maps of California, focusing on the San Andreas Fault system. The comparison of where California is...
Curated OER
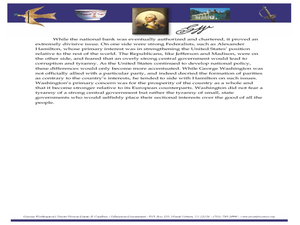
Using Political Cartoons to Understand Historical Events
Examine historical perspectives through the use of political cartoons. Learners complete analysis activities related to the president's title, the establishment of the national bank, and the Jay Treaty.
Other popular searches
- Data Display
- Misleading Data Display
- Appropriate Data Display
- Graphs and Data Display
- Display Simple Data
- Analyze Data Displays
- Data Display Center
- Voluntary Data Display
- Best Data Display
- Rates and Data Display
- Simulation Data Display
- Ways to Display Data


