Curated OER
Graphing Data - Temperature
Seventh graders measure and record temperature over a given time period. They compare the recorded temperatures to the 40-year recorded normal average temperatures for the same area. Students display and interpret their findings in a graph.
Curated OER
If .... Then Probably
Students are introduced to the concepts of probability and chance. Using data given to them, they organize and create a chart to display the information. Using this chart, they calculate the percentage of chance and probability and...
Curated OER
"Publication" of Scientific Papers And Posters
Students create and display a scientific poster in the same format that scientists use at a research symposium. They compile data and make conclusions about the classification of the Arizona Hedgehog Cactus as an endangered species. ...
Curated OER
Algebra 2 - Linear Programming
Young scholars read real world problems, determine the variables, and set up the function using algebraic statements. After entering data into the graphing calculator, they display information in the form of graphs and scatter plots. ...
Curated OER
Caldecott Medal Winners
Second graders identify Caldecott Medal winners. In this library media lesson, 2nd graders view an overhead transparency of Caldecott Medal winners from 1987-2004 and answer questions based on the data that is displayed.
Curated OER
A Matter of Fact
Students design their own Science experiment. In this science experiment lesson students create a hypothesis related to matter and test it. They displayed their data in a graph.
Curated OER
It's A Jungle in Here!
Fifth graders research rainforest destruction. In this geography and ecology lesson, 5th graders work as a group to research the effects of logging, farming, and mining on the rainforest. Students gather and display data and information...
Curated OER
School Yard Waste
Fourth graders examine the types of garbage that they collect on the playground. They collect the information in a spreadsheet and create a graph that displays the number of types of trash found. They design and monitor a playground...
Discovery Education
It's Too Loud!
STEM scholars investigate sound attenuation by conducting an experiment in which they compare the farthest distance that they can hear a sound with and without ear protection.
Curated OER
Pizza Possibilities
Middle schoolers create and interpret line plots, bar graphs, and circle graphs. The lesson assumes mastery of conversions from fraction to decimal to percent, construction of angles, and at least an introduction to graphs displaying data.
Curated OER
Science Fair With An Energy Efficiency Flair
In order to learn more about energy conservation, pupils work to promote energy efficiency by participating in a school-wide science fair with an emphasis on energy conservation. In addition to displaying their projects, learners invite...
Curated OER
Using Amino Acid Sequences to Show Evolutionary Relationships
Compare protein fragments, count amino acids, and use the information to explore common ancestry. The resource mentions a student worksheet, however, a separate printable worksheet is not provided. The exercises are written into the...
Curated OER
Making a Thermometer
Students observe a demonstration of how a thermometer functions. They apply the scientific method while determining which of three cups hold the coldest water. They write a hypothesis before conducting the experiment and gather data.
Curated OER
Problem Solving and the Sports Page
The use of box scores from baseball games is the foundation of this math lesson. Organize your class into groups of four, and give identical box scores from a baseball game that was just played. Have them create word problems from the...
Curated OER
What Are You Eating?
Discover the calorie content of foods by observing how much heat they produce in water. If you have a calculator-based laboratory (CBL™) insturment for collecting data, then this laboratory worksheet will not need any changes. If not,...
Curated OER
Sink/Float Discovery bottle
Investigate which items float and which ones sink using this resource. Learners participate in an activity in which they investigate this phenomena. Then they describe the experimental process, and learn how to display their results.
Curated OER
Re-Presenting Race in the Digital Age
Teen-aged scientists analyze a graphic organizer of how trash is removed from New York City and then answer standard questions about a graph and a diagram. Resources are mentioned, but there are no links to these resources, so you will...
Multiverse
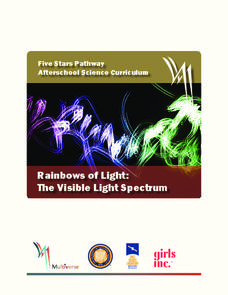
Rainbows of Light: The Visible Light Spectrum
Rainbows can teach us about the visible light spectrum. Learners observe multiple items that clearly display a rainbow to develop better connections. The lesson then explains wavelength using a rope to make waves.
Curated OER
Breakfast Cereal - How Nutritious Is Yours?
Students analyze the nutritional value of breakfast cereal in order to make an informed choice. They create a stem and leaf plot which analyzes the nutritional value of the cereal they eat on a regular basis. Students write a letter to...
Curated OER
Graphing With Paper and Computers
Fourth graders construct bar graphs. In this graphing lesson, 4th graders create bar graphs in connection with the story, The Copycat Fish. After creating the initial graphs on paper, students use MS Excel to create graphs.
Curated OER
Cent Sense
Students identify money values. In this money lesson, students sort and group coins by value and investigate the cost of supplies needed for a snack. Students prepare snacks for a snack sale.
Curated OER
Food Classification
Students are introduced to classification and some of the difficulties surrounding classification and how classification systems need to be able to adapt and how they may need to be changed when new information is discovered. They...
EngageNY
More Practice with Box Plots
Don't just think outside of the box — read outside of it! The 15th lesson in a 22-part unit provides pupils more work with box plots. Learners read the box plots to estimate the five-number summary and interpret it within the context....
EngageNY
Presenting a Summary of a Statistical Project
Based upon the statistics, this is what it means. The last instructional activity in a series of 22 has pupils present the findings from their statistical projects. The scholars discuss the four-step process used to complete the project...
Other popular searches
- Data Display
- Misleading Data Display
- Appropriate Data Display
- Graphs and Data Display
- Display Simple Data
- Analyze Data Displays
- Data Display Center
- Voluntary Data Display
- Best Data Display
- Rates and Data Display
- Simulation Data Display
- Ways to Display Data


