Curated OER
Recognizing Bias in Graphs
In this bias in graphs worksheet, students examine graphs and explain the data. They determine why the graph is or is not biased. This four-page worksheet contains approximately 6 problems. Explanations and examples are provided.
Curated OER
Jumping in the Air - What was your Height?
Students solve equations using the quadratic formula. In this quadratic equations lesson, students use digital cameras to film students jumping and import film clips into a computer. Students use the data in the quadratic formula...
Curated OER
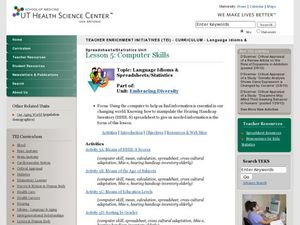
Computer Skills
Students research computer information and use it to find the mean of things. In this computer skills activity students are given activities in which they calculate and use a spreadsheet to enter data on the mean of their assignment.
Curated OER
Polling and Statistics
Young scholars investigate polling. In this statistics lesson, students collect data-on polling and graph their data on a coordinate plane. They identify biased and non-biased polling.
Curated OER
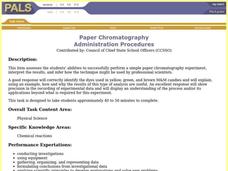
Paper Chromatography
Small groups of students perform paper chromatography to separate food dyes into their component colors. Students perform the experiment and collect, organize, and represent their data to form an explanation of their outcomes. Students...
Curated OER
Move To a Healthier Aquatic Balance
Fourth graders examine aquatic orgnaisms and how enviromental chages affect them. This factors include: temperature, Ph, oxygen, nutrients, and pollutants. They also explore habitat quality (erosion). Students compile data and create...
Curated OER
Let's Take a Chance!
Students investigate probability and the chance of an even happening. In this algebra lesson, students incorporate their knowledge of probability to solve problems and relate it to the real world. They learn to make decisions based on data.
Curated OER
Heat Loss
Students comprehend how heat loss is affected by exposed surface area. They decide what type of and how many data to
collect. Students decide how the results should be presented. They make a series of accurate observations
Curated OER
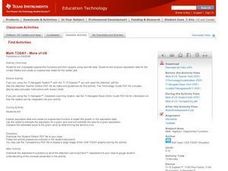
More of U.S.
Explore graphical representation of a real-life data set and determine the exponential regression model for the data in your classroom. Learners also compare the estimated value to the given value by determining the percent error.
Curated OER
Working With Local Computer Policies
In this technology worksheet, students practice setting up a computer system or network to go through the access process for data and logons.
Curated OER
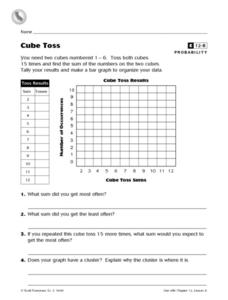
Cube Toss
In this probability and graphing worksheet, students solve 8 problems in which data from a cube toss is displayed on a table and graph. Students answer the questions about their results.
Curated OER
Practice Dividing by 8
In this dividing by 8 worksheet, students use the data in the math table to help them complete the pictograph chart on the right. Students use the pictograph to help them answer the six word problems.
Curated OER
My Perfect Pet
Students explore pet ownership. In this my perfect pet lesson plan, students research common animals used as pets and complete a variety of activities based on this data.
Curated OER
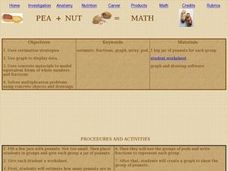
Pea+Nut = Math
Students utilize peanuts to practice fractions. In this math model lesson, students solve multiplication problems and fractions with real peanuts. Students use drawing software to graph data from the math equations.
Curated OER
Looking Normal
Students identify the shape of a function. In this statistics lesson, students plot the data collected. They analyze their data for positive, negative or no correlation. They find the line of best fit.
Curated OER
Planet Research and Brochure
Fourth graders design a brochure based on the planet that they researched. In this planets lesson plan, 4th graders include the data, important facts, and completed as a team.
Curated OER
Christmas Presents
Seventh graders create a graph of their Christmas gifts. They develop categories, compute fractional and decimal parts for each category, identify the number of degrees to represent each fractional part, and create a circle graph to...
Curated OER
Find Minimum and Maximum
Learners engage in a lesson about finding the values of different graphs written in the vertex form. They rewrite each quadratic equation in vertex form while graphing the equation with the visual display of a parabola that matches the...
Curated OER
A Thanksgiving Survey
Students conduct a survey. In this math lesson, students design and conduct a survey about Thanksgiving foods. Students display the collected data in a graph and use the graph to determine what food to serve for a Thanksgiving meal.
Curated OER
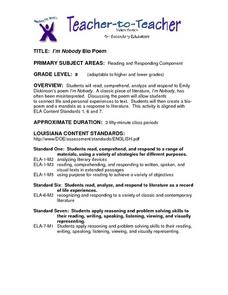
I'm Nobody Bio Poem
Eighth graders analyze Emily Dickinson's poem, I'm Nobody. After discussing it, they create their own bio poem. They draw and label mandalas and display them in class.
Curated OER
Energy Balance: The Ins and Outs
Pupils review data from a 24-hour dietary recall to gain an understanding of the information regarding energy intake and macronutrients.
Curated OER
Communicable Disease
Young scholars use Palms, or handheld computers, and the Cooties software to enact the transmission of communicable diseases. They discuss incubation and immunity and collect and interpret data and figure out who was the "carrier "of a...
Curated OER
PLANNING A DIVERSIFIED INVESTMENT PORTFOLIO
Twelfth graders research stocks and how to read and interpret financial data. They choose 5 companies to invest in and track their performance over 10 weeks. They create a spreadsheet which shows the results.
Curated OER
The Codex Comes Home: Leonardo Lives in Seattle
Students complete a unit on the life of Leonardo da Vinci and the content of the Codex Leicester. They write an encyclopedia entry, watch a film, complete a data sheet, conduct Internet research, and write a letter to Bill Gates about...
Other popular searches
- Data Display
- Misleading Data Display
- Appropriate Data Display
- Graphs and Data Display
- Display Simple Data
- Analyze Data Displays
- Data Display Center
- Voluntary Data Display
- Best Data Display
- Rates and Data Display
- Simulation Data Display
- Ways to Display Data


