Virginia Department of Education
Graphs
Examine different types of graphs as a means for analyzing data. Math scholars identify the type of graph from a series of data displays and then develop questions to match each one. Then, given a scatter plot of height versus age data,...
Bowland
Tuck Shop
Correct a misleading conclusion. Individuals review a set of data and a conclusion to determine what is wrong with the conclusion. Pupils then represent the data with an appropriate display. Finally, learners develop a correct conclusion...
EngageNY
Comparing Distributions
Data distributions can be compared in terms of center, variability, and shape. Two exploratory challenges present data in two different displays to compare. The displays of histograms and box plots require different comparisons based...
CK-12 Foundation
Double Bar Graphs: Favorite Cookies Chart
It's just the way the cookie crumbles. Using the data from a class poll, learners create a double bar graph showing favorite cookie types. The pupils compare favorites between boys and girls with the aid of their graphs, then they make...
CK-12 Foundation
Single Bar Graphs: Hockey Teams
Raise the bar for hockey fans. Using data about favorite hockey teams, pupils build a bar graph. They use the information from the graph to make comparisons and solve one- and two-step problems.
University of Georgia
Freezing and Melting of Water
Examine the behavior of energy as water freezes and melts. An engaging activity provides a hands-on experience to learners. Collaborative groups collect data and analyze the graphs of the temperature of water as it freezes and then...
Radford University
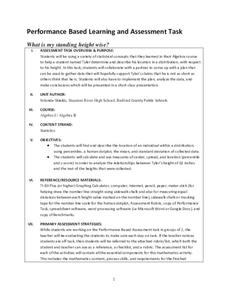
What is My Standing Height Wise?
Given a scenario in which a class member wants to prove his height is not an outlier, pairs devise a plan and gather evidence to help support his claim. The small groups implement their plans and create graphical displays of their data...
Radford University
Is Fall Normal?
Fine the normality of fall measurements. Pairs collect measurements of fall leaves and one other fall object. Using the measurements, the groups determine the descriptive statistics for the object and using the Empirical Rule, figure out...
CK-12 Foundation
Mode: Boxes of Oranges
See how your data stacks up. Pupils stack crates of oranges in increasing order, creating a simple bar graph. Using the graph, individuals determine measures of center and describe the shape of the distribution. Scholars determine what...
Concord Consortium
People and Places
Graph growth in the US. Given population and area data for the United States for a period of 200 years, class members create graphs to interpret the growth over time. Graphs include population, area, population density, and population...
Teach Engineering
Building-Testing-Improving Paper Airplanes: Head's Up!
Take foldables to all new heights. Pupils build and fly different types of paper airplanes in the 14th portion of a 22-part unit on aviation. Groups collect data on distance and flight time for each plane and compare the data from the...
PBL Pathways
Doctors and Nurses
How many nurses does it take to support one doctor? A project-based activity asks learners to analyze state data to answer this question. Classes create polynomial functions from the data of doctors and nurses over a seven-year period....
CK-12 Foundation
Two-Sided Stem-and-Lead Plots: Gamers
Which gender spends more time playing video games? Your classes use provided data to answer this question. They first build a two-sided stem-and-leaf plot and then use the display to look for patterns. Guiding questions help them...
American Statistical Association
How Long Are the Words in the Gettysburg Address?
It's 268 words, but one only needs to consider 10 of them at a time. A data collection and analysis activity has learners investigate the lengths of words in the Gettysburg Address. They first self-select a sample of 10 words and...
US Department of Commerce
Featured Activity: Population Change Over Time
Keep track of a state's population. After a brief discussion on how population data is used for funding, individuals look at population changes over time. Pupils find the population of two states using three different censuses. They then...
American Statistical Association
A Tale of One City and Two Lead Measurements
Lead the way in learning about lead contamination. Pupils first read several articles about the Flint water crisis and the EPA's rules for lead concentration. They use provided data from 71 Flint water wells to compute the 90th...
PBS
Investigating Seasonal Temperature and Precipitation Variations
Weather seems unpredictable, but is it really? Learners collect weather data from online interactives and build data displays. They use their displays to identify temperature and precipitation patterns in different areas.
US Department of Commerce
How Are Single-Parent Households Distributed Across the United States?
There sure are a lot of single-parent households in the country. After selecting one of four US regions to investigate, pupils create dot plots and box plots on the percentage of single-parent households with male parents and female...
Shodor Education Foundation
Multiple Linear Regression
You'll have no regrets when you use the perfect lesson to teach regression! An interactive resource has individuals manipulate the slope and y-intercept of a line to match a set of data. Learners practice data sets with both positive and...
Curated OER
Lesson Plan Outline for Rainbow Science
Young scientists study light reflection and refraction as they determine the critical angle, the rainbow angle, and color separation in rainbows. Teams record the data they collect in a shared spreadsheet and discuss results with the class.
Curated OER
Position vs. Time Graphs of an Object at Rest
The presentation includes nine time vs. position graphs. The first three are meant to be used for teaching how to read them. The next three provide an opportunity for students to practice reading them, while the last three display the...
Lane Community College
Review Sheets: Beginning Algebra
This jumbo worksheet contains everything you need to get through Pre-Algebra. Begin with simple expressions, and end with linear functions and polygons. There are multiple problems for each topic to make sure those skills are set.
Curated OER
Data Analysis
In these data analysis worksheets, students complete 4 worksheets of activities for analyzing data. Students use the mean, median, mode, and range to organize the data.
Curated OER
Dealing With Data
Students collect, organize, and display data using a bar graph, line graph, pie graph, or picture graph. They write a summary describing the data represented and compare the graph to another graph in the class.
Other popular searches
- Data Display
- Misleading Data Display
- Appropriate Data Display
- Graphs and Data Display
- Display Simple Data
- Analyze Data Displays
- Data Display Center
- Voluntary Data Display
- Best Data Display
- Rates and Data Display
- Simulation Data Display
- Ways to Display Data


