Willow Tree
Line Graphs
Some data just doesn't follow a straight path. Learners use line graphs to represent data that changes over time. They use the graphs to analyze the data and make conclusions.
Bowland
Speed Cameras
Do speed cameras help reduce accidents? Scholars investigate this question using a series of spreadsheet activities. Along the way, they learn about randomness, probability, and statistical analysis.
Kenan Fellows
Man vs. Beast: Approximating Derivatives using Human and Animal Movement
What does dropping a ball look like as a graph? An engaging activity asks learners to record a video of dropping a ball and uploading the video to software for analysis. They compare the position of the ball to time and calculate the...
Curated OER
Using Random Sampling to Draw Inferences
Emerging statisticians develop the ability to make inferences from sample data while also working on proportional relationships in general. Here, young learners examine samples for bias, and then use random samples to make inferences...
Virginia Department of Education
Work and Power
Assist your class with correctly calculating the values for force, work, and power as they determine the amount various activities require. They gather data and participate in a group discussion to compare results upon conclusion of the...
Curated OER
The Demographics of Immigration: Using United States Census Data
Learners work together to analyze United States Census data on immigration. They compare and contrast the data and determine how immigration numbers have changed over time. They calculate percentages and make their own conclusions...
Curated OER
Observations (collecting data)
Students observe and collect data about the earthworm. In this observation of an earthworm lesson plan, students use an earthworm to determine the effects of light and incline on the earthworm's behavior. They practice making...
Curated OER
Handling Data: measure of Average
Fifth graders analyze data from a simple table. In this graphing instructional activity, 5th graders compare distributions. Students recognize that the mean helps them find the formula. Students answer questions on the mean, median,...
Curated OER
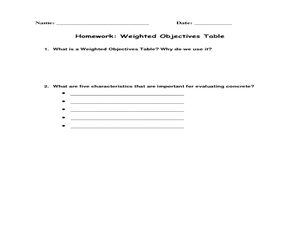
Weighted Objectives Table and Optimum Mix Sheet
Young scholars analyze data and determine an appropriate concrete mixture. In this technical solutions lesson plan, students discuss weighted objectives, review sample scenarios, and rate concrete recipes to identify how well water...
Curated OER
Frequency Tables
Seventh graders construct frequency tables and box-and-whisker plots. After constructing tables and plots, they take a quiz on mean, median, mode, range, scientific notation, and number properties.
Curated OER
Data Analysis and Probability
Students make their own puzzle grid that illustrates the number of sit-ups students in a gym class did in one minute, then they make a histogram for this same data. Then they title their graph and label the scales and axes and graph the...
Curated OER
Analysis of Data
Learners analyze DNA banding patterns for similarities and differences among individuals and between populations. They examine individual prepared gels then pool the class data to come to an overall conclusion.
Curated OER
First Class First? Using Data to Explore the Tragedy of the Titanic
Students analyze and interpret data related to the crew and passengers of the Titanic. They research information on a Titanic database to illustrate specific statistical conclusions, and whether or not social status affected the outcome.
Curated OER
Guess My Rule: Diversity of Learners Adaptation
Students write equations if they change the data of the population to find patterns. They look for patterns in the data regarding male to female ratio (using the lowest possible). Students write a short story for the data that changes...
Curated OER
Interpreting Data and Statistics
Students define terms and analyze data. In this statistics lesson, students plot their data using bar and line graphs. They analyze their data after they graph it and apply the results to the Great Depression.
Curated OER
Hess' Law Data Sheet
In this Hess' Law worksheet, students write their data and calculations from the lab they performed on Hess's Law. They calculate the heat of reactions per mole of substances used and calculate the theoretical heat of reaction and...
Curated OER
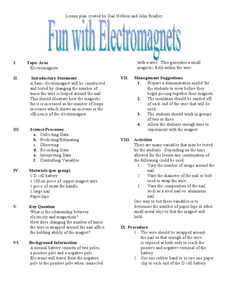
Fun with Electromagnets
Junior scientists work in groups to construct electromagnets. They experiment by varying number of wraps around the nail, the diameter of the nail, and the type of metal the nail is made of to see if any of these factors has an effect on...
Curated OER
Remembering Our Veterans Data Management Project
Seventh graders utilize data collected from various sources based on Canadian military statistics to consolidate their understanding of data management. Students plan and create a PowerPoint presentation using this data including in...
Curated OER
Looking at Data
Third graders use two days to create, collect, display and analyze data. Classroom activities and practice build greater understanding to a variety of forms used to display data.
Curated OER
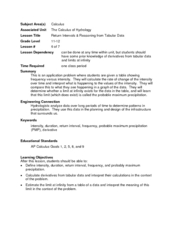
Return Intervals & Reasoning from Tabular Data
Learners calculate derivatives from a set of data. In this calculus instructional activity, students estimate the limit at infinity. They complete a Return Interval handout at the end of the instructional activity.
Curated OER
The Periodic Table
Students research an assigned element using the library, an encyclopedia, the Internet and other appropriate resources in order to write a research paper, a project, and an oral presentation.
Curated OER
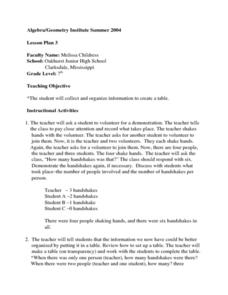
Creating a Data Table
Seventh graders explore organizing data into a table. The teacher leads a handshaking activity among the class. They collect the information concerning the number of handshakes each person received. Students discover a pattern. They...
Curated OER
Explore: Collect And Organize Data
In this exploring how to collect and organize data worksheet, young scholars, working with a partner, problem solve the answers to seven word problems involving data.
Curated OER
Building Data
Students collect census data to help them determine where to build a new supply superstore.


