Curated OER
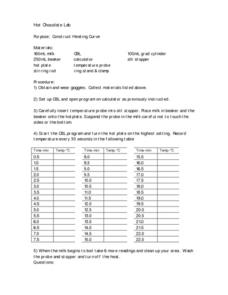
Hot Chocolate Lab
Students wear goggles and collect materials and then set up computer program to use the temperature probes. They insert the probe into the milk recording temperature every 30 seconds and then record the data on the table.
Curated OER
Old Glory
Learners utilize mathematical concepts such as: measurement, ratio and proportion and geometric probability to analyze the components of the U.S. Flag. They collect, organize and interpret data by constructing charts, tables and graphs...
Curated OER
Will It Sink Or Float?
Have your class predict whether objects will sink or float in water. Learners consider a data table of mass, volume and whether the object sank or floated. They develop an evidence-based explanation for the results.
Curated OER
Introduction to Graphs
Students poll classmates to gather information for a graph. They identify three types of graphs (bar, line, table). Students create each type of graph using data gathered from classmates.
Curated OER
Fun with Math using Magnetic Force
Sixth graders explore and discuss the effectiveness of magnets in different situations. In this math lesson, 6th graders discuss rate and graphs after exploring with magnets using different restrictions on the magnets. They analyze their...
Curated OER
How Much is There to Eat?
Students examine food production related to population density. In this interdisciplinary lesson, students gather data regarding food production in the American South and in India. Students follow the outlined steps to calculate the...
Curated OER
Echinacea No Cure all for Kids
High schoolers look at real data and answer the question of whether or not they would recommend Echinacea to cure a cold. In this investigative lesson students describe whether the data supports the hypothesis that echinacea shortens the...
Curated OER
Ocean Life: A Heavy Subject
Second graders examine The Learning Page Fact Files about ocean life and categorize the data by weight and group. They distinguish between fish, mammals, and invertebrates and which weigh the most and the least. Students record their...
Curated OER
Investigation - Looking For Triangles
Seventh graders investigate a series of triangles, looking for patterns and generalizing what they have found. They analyze the pattern data and organize it into a table and graph. Students identify the relationship and discover the rule...
Curated OER
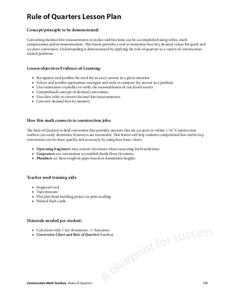
Rule of Quarters
Young scholars memorize four key decimal values for quick and accurate conversion. They convert decimal foot measurements to inches and fractions using math tables, computation or memorization. They memorize decimal foot conversions.
Curated OER
Lesson 3 How Do You Read Stock Quotes Online ?
Students understand how to get and interpret stock price data online. They describe certain aspects of various corporations and know the meanings of important terms involving the stock market.
Curated OER
Team Apollo
Seventh graders brainstorm about problems with a school track. They research different possibilities for a solution. They test different track materials with erosion, durability, abrasiveness and resiliency. They determine the area,...
Curated OER
Favorite Apple Graph
First graders record their favorite type of apple in the form of a graph. They each try one slice of a Red Delicious, Golden Delicious, and Granny Smith apple, select their favorite type, and create a class graph using the data collected.
Curated OER
Capture/Recapture
Students use proportions to estimate the size of populations. They describe the data with using a graph or table of the estimate. Students use descriptive statistics to calculate mean, median, and mode. They also compare and contrast an...
Curated OER
Plugging Into The Best Price
Examine data and graph solutions on a coordinate plane with this algebra lesson. Young problem-solvers identify the effect of the slope on the steepness of the line. They use the TI to graph and analyze linear equations.
Curated OER
Favorite Food
Students are given three choices of food. They then decide on their favorite and predict what the class's favorite food will be. After the teacher enters the data into the computer, students gather around the computer to view the...
Curated OER
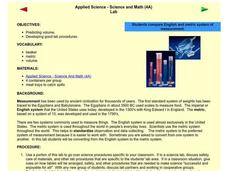
Applied Science - Science and Math Lab
Although it was written to use in a science class, this measurement lesson is adaptable to Common Core standards in math for measurement and data. Youngsters are introduced to two types of measurement systems. They use both the English...
Curated OER
Germs Experiment 2
Students express artistic ideas thru art glitter and science. Students experiment with the theory of how germs spread. Students summarize findings in an art format. Students work in groups to analyze data.
Curated OER
Hypothesis Testing
Learners investigate the finding of a hypothesis and how it can be tested.For the experiment they will be using the concept of probability. Students design an experiment and test the hypothesis. Then the results are graphed showing the...
Curated OER
Windmills and Blogs: The Impact of Technology in Rural Peru
How does technology affect a community? Research the benefits and consequences of technology in rural Peru. For this technology lesson, learners discuss how the effects of technology. They view a PowerPoint and learn about the Peace...
Curated OER
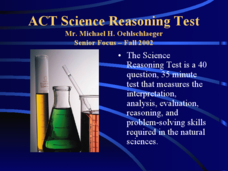
ACT Science Reasoning Test
The types of scientific information that need to be analyzed in the ACT test are presented here. Tips and techniques for completing the research, data, viewpoints, and multiple choice questions will help your class and their expectations.
Curated OER
Using Basic Properties to Solve Problems in Math
Learners identify and define the rules of properties of real numbers. They rewrite each of the problems listed using the commutative or associative properties. Pupils apply problem solving strategies to clarify situations in a table...
Curated OER
Election Poll, Variation 2
When a random sample isn't enough, your math class can compare the data from a physical simulation to decide if the probability is still likely. The lesson is part of a probability series that focuses on one question and different ways...
Curated OER
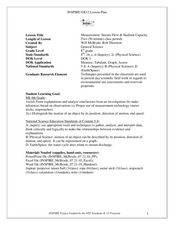
Measurement: Stream Flow & Stadium Capacity
Eighth graders study the scientific fields and how information can be monitored and recorded. For this scientific inquiry lesson students view a PowerPoint presentation and complete a hands on activity.


