Curated OER
Periodic Table Lesson Plan
Students describe how elements are arranged on the periodic table. They compare metals, nonmetals, and metalloids based on their properties and on their locations in the periodic table. Students describe the differences between a...
Curated OER
Compare and Contrast Culture
Fifth graders compare and contrast the cultures of American culture with that of the other cultures of North America. Using traditional and Internet research, 5th graders gather data on one element of culture for comparison. Data...
Curated OER
Exploring F function Graphs
Using three set of data that relate temperature to another variable, 10th graders will use graphs, tables, or equations to make predictions about data. Students will identify the relations as linear or non-linear. Students will define...
Curated OER
Data Analysis
In this data analysis worksheet, pupils solve and complete 4 different types of problems. First, they reduce the data provided to find the means, and graph the means in a line graph. Then, students graph the data from each mixture shown...
Curated OER
Using Radiosonde Data From a Weather Balloon Launch
Student use radiosonde data from a weather balloon launch to distinguish the characteristics of the lower atmosphere. They learn the layers of the atmosphere. They graph real atmospheric data.
Curated OER
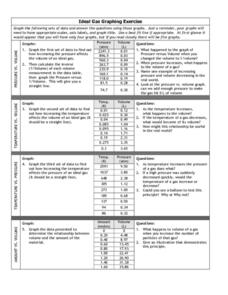
Graphing Exercise of Ideal Gas Data
For this graphing of Ideal Gas Data worksheet, students use the given data to draw 4 graphs of the given data. They are given the pressure and volume to draw and interpret the graphs.
Curated OER
Frequency Tables and Histograms
In this graph worksheet, 5th graders study the data presented on a bar graph. Students then respond to 4 short answer questions using the information that has been provided.
Curated OER
Independent Investigation
In this science worksheet, students write what they want to discover and identify what they feel will happen. Then they design an experiment and write the steps for it in the space provided. Students also create a data table or chart...
Curated OER
Astronomical Data
In this astronomy worksheet, students use a chart with planetary data comparing the inner planets to each other. Students will use the period of rotation, period of revolution, and distance from the sun for these inner planets to...
Curated OER
Variation
In this variation worksheet, students interpret and organize data. They find the distance between points. Students use ratios to determine volume This six-page worksheet contains approximately 20 problems. Answers are provided on the...
Curated OER
Interpreting and creating tables
Young scholars observe examples and discuss how to interpret them. They then
brainstorm examples of possible questions students could use to create a table. They take time to formulate a question and collect data.
Curated OER
Meatiest States: Graph Problem Solving
For this graph problem solving worksheet, learners analyze a graph that shows commercial red meat production in five states. Students answer 5 word problems using the data on the graph.
Curated OER
Counting Squares
For this counting squares worksheet, students solve 2 problems that include counting 2 different sets of squares. First, they draw a picture of four squares arranged in two rows of two. Then, students determine the total number of...
Curated OER
Solving Equations with a Table
In this solving equations with a table worksheet, 6th graders use the data in the table to solve seven problems, completing the table as they work.
Curated OER
Histograms and Frequency Tables
In this statistics learning exercise, students solve and analyze graphs. They use histograms and frequency tables to solve their problems. There are 2 multiple choice questions with an answer key.
Inside Mathematics
Scatter Diagram
It is positive that how one performs on the first test relates to their performance on the second test. The three-question assessment has class members read and analyze a scatter plot of test scores. They must determine whether...
EngageNY
Conditional Relative Frequencies and Association
It is all relative, or is it all conditional? Using an exploration method, the class determines whether there is an association between gender and superpower wish through the use of calculating conditional relative frequencies. The last...
College Board
Is That an Assumption or a Condition?
Don't assume your pupils understand assumptions. A teacher resource provides valuable information on inferences, assumptions, and conditions, and how scholars tend to overlook these aspects. It focuses on regression analysis, statistical...
PBS
Working with Coordinate Planes: Assessments
It's time for scholars to show what they know about coordinate planes with a collection of three assessments. The exams' objectives include plotting points on a single grid, measuring using the distance formula, and identifying points on...
Florida Department of Health
Safe and Happy: Safety for All at School and Online Unit
Bystander or upstander and advocate? Three lessons have high schoolers investigating data about bullying and school safety. Participants then learn how to take a stand against bullying and use what they have learned to create a PSA to...
Curated OER
Weather instruments
Students explore weather instruments. In this weather lesson, students make rain gauges, anemometers, and barometers following the instructions given in the lesson. Students set up a weather station using their instruments and record and...
Education Development Center
Interpreting Statistical Measures—Class Scores
Explore the effect of outliers through an analysis of mean, median, and standard deviation. Your classes examine and compare these measures for two groups. They must make sense of a group that has a higher mean but lower median compared...
Illustrative Mathematics
Foxes and Rabbits 2
The fox population chases the rabbit population. Groups model the populations of foxes and rabbits with two trigonometric functions. Individuals graph both trigonometric models on the same graph, and then teams determine an explanation...
Curated OER
Burger King Investigation
Young scholars study data on the nutritional value of Burger King meals in order to discover its nutritional value and also to compare the meals, using mathematical computation, to the recommended daily diet. In this data handling...


