Biology Corner
Random Sampling
Simulate a random sampling of data by tearing 20 sheets of paper into slips and place a number on 10 and a letter on 10. They place the slips in two separate containers and randomly draw a number and a letter. They record their...
Curated OER
Lifting a Load
Students experiments with levers to determine if the amount of force needed to lift a load is always the same. For this physics lesson, students use Lab-Pro data collector as they experiment with the fulcrum placement to measure the work...
Curated OER
Baseball Relationships - Using Scatter Plots
Students use graphing calculators to create scatter plots of given baseball data. They also determine percentages and ratios, slope, y-intercepts, etc. all using baseball data and statistics.
Curated OER
Rhinos and M&M's
Students analyze patterns of exponential models by collecting data in paper folding and M&M investigations. They use graphing calculators to create scatter plots that lead to equations for the exponential models. They then apply this...
Curated OER
How Texas is Planning To Manage Its Water
Students research water management strategies in Texas. They analyze projected demand for water in the year 2050, interpret graphs and tables and then discuss the data as part of a written report. They research and map the locations of...
Curated OER
What's Your Favorite Planet?
Fourth graders, after listing the nine planets and their differences, choose one planet as their favorite. From the information acquired on each students favorite planet, they make a graph illustrating their favorites and then transform...
Curated OER
Where Do I Fit on the Graph?
Students collect data and create graphs about themselves, their community, and the world around them. They use a variety of methods to organize data, such as stickers, clothespins, name tags, coloring, tally marks, etc.
Curated OER
Excel temperature Graphs
Students gather data about the weather in Nome, Alaska. In this Nome Temperature lesson, students create an excel graph to explore the weather trends in Nome. Students will find the average weather and add a trend line to their graph.
Curated OER
Geography And The Gulf War
Young scholars develop maps, tables, graphs, charts, and diagrams to depict the geographic implications of current world events, and analyze major human conflicts to determine the role of physical and cultural geographic features in the...
Curated OER
Global Statistics
Students determine statistics based on data. In this statistics lesson, students use data and record in charts. Students create graphs based on the statistics found.
Curated OER
EXCEL It!
Learners surf the Web gathering information about graphs. The data collected is incorporated into an Excel spreadsheet and graphs of varying nature generated to further enhance student understanding.
Curated OER
Geologic cross section of Manhattan, NYC
Students draw an accurate geologic cross section by using a given data table. They relate the features of the cross section to geologic processes. Students then relate the characteristics of the bedrock to the architecture.
Curated OER
Fizzy Pop
Fifth graders compare and identify variables that affect the rate of a chemical change using Alka-Seltzer, water, ice, and hot water. They time how long each variable takes to pop the canister into the air, and record the results on a...
Curated OER
Math: Graphs and Their Symbols
Second graders examine different types of graphs and discover the meanings of the symbols used on them. After gathering data about themselves, their communities, and the world, they use that information to create graphs. Among the...
Curated OER
Get a Half-Life!: Student Worksheet
In this math/science worksheet, students will work in pairs to conduct an experiment based on a decay function which is often used to model radioactive decay. Students will shake M & M's in a cup to rub off the M and then record...
Curated OER
Making Sounds
Students perform three experiments to gain understanding of how pitch changes. In this sound lesson, students create a variety of sounds with different pitches. Students will record their data as the observe the differences in the sounds...
Curated OER
Functions & Algebra
Students examine linear equations. In this functions and algebra lesson, students write equations in the slope-intercept form. They enter data in a graphing calculator, examine tables, and write linear equations to match the data.
Curated OER
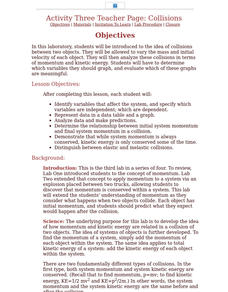
Activity Three Teacher Page: Collisions
Students after completing this lesson, identify variables that affect the system, and specify which variables are independent; which are dependent. They represent data in a data table and a graph and analyze data and make predictions.
Curated OER
Lines of Fit
Students graph an equation and analyze the data. In this algebra lesson, students graph scatter plots and identify the line of best fit using positive correlation, negative correlation an d no correlation. They apply their data analysis...
Curated OER
The Lynx Eats The Hare
Students investigate the predator and prey relationship. This is done using a simple simulation. The simulation is done as an arts and craft activity. Students record data and track it using a graphic organizer and then they discuss the...
Curated OER
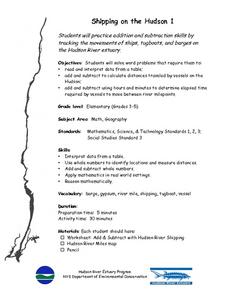
Shipping on the Hudson
Students track movements of ships, tugboats, and barges on the Hudson River estuary in order to practice addition and subtraction skills. They solve word problems by reading and interpreting data from a table. They calculate distances...
Curated OER
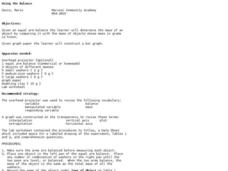
Using the Balance
Students determine the mass of various objects. In this integrated math and science lesson, students use an arm balance to compare a known object to a combination of washers with a fixed weight. Students record data, construct a bar...
Curated OER
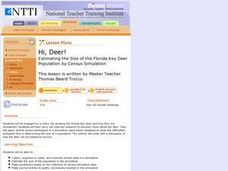
Hi, Deer!
Students collect, organize by table, and examine census data in a simulation, estimate the size of the population in the simulation and make predictions based on the collection of census simulation data.
Curated OER
Poetic Math Greeting Cards
Fourth graders work in groups; collect data in a survey; depict in tables, charts, or graphs the results of the survey; and make predictions. They use creative writing skills and computer skills to generate a greeting card of their own.


