Curated OER
Descriptive Statistics
Students demonstrate how to use frequency and scatter diagrams. In this statistics lesson, students are introduced to different techniques of representing data. Students sort and graph data on a worksheet and use a frequency diagram to...
Curated OER
A Day at the Beach
Student read Sheryl Wilson's story, "A Day at the Beach" while classifying items they find. They design a chart of the items before using educational graphing software to create a graph.
Curated OER
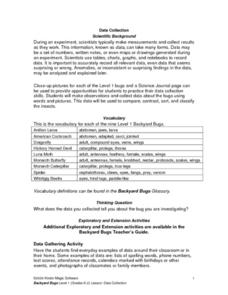
Science: Backyard Bugs Data Collection
Students practice data collection skills by observing common bugs found in their local environment. Once the data is collected they complete data sheets to compare, contrast, sort, and classify the insects. The lesson includes...
Curated OER
The Winner Is...
Students create graph from previously collected data using "The Graph Club."
Curated OER
Get a Half Life!
Eighth graders use M&M's to experiment with data. They use a graphing calculator to determine the best equation for their data; linear, quadratic or exponential. They analyze the data to find the half-life of their M&M's.
Curated OER
VARIABLES AND PATTERNS, USE AFTER INVESTIGATION THREE. DISCRETE OR CONTINUOUS LINEAR RELATIONS.
Learners discover for which kind of linear function is appropriate to use the "scatter" or the "connected" term. In this instructional activity, students investigate functions using variables, patterns book, graph paper, rulers and the...
Curated OER
Birthdays
Students collect data about the birth months of each classmate using a calendar. They make a table with the information before designing a pictograph using cupcake images. They answer questions using the graph.
Curated OER
Tune...Um!
Students collect real data on sound. For this algebra lesson, students use a CBL and graphing calculator to observe the graph created by sound waves. They draw conclusion about the frequency of sound from the graph.
Curated OER
Radioactive Decay
Students generate a radioactive decay table for an imaginary element, use their data to plot a decay graph, develop the concept of half-life, and use the graph to "age" several samples.
Curated OER
Weather Report Chart
Young scholars complete a weather report chart after studying weather patterns for a period of time. In this weather report lesson plan, students measure temperature, precipitation, cloud cover, wind speed, and wind direction for a...
Curated OER
Valentine's Day Math
First graders explore sorting and classifying. In this math lesson, 1st graders sort conversation hearts based on color. Students graph their results and enjoy the candy!
Curated OER
Ocean Botttom Profile
Students interpret a graph of ocean depths and topographic features. This task assesses students' abilities to interpret figures, organize and represent data, apply knowledge of scale to a profile, and apply theoretical knowledge.
Curated OER
Atlatl Lessons for Grade 4
Fourth graders explore the weapons of the Aboriginal people. In this fourth grade math lesson, 4th graders create charts, tables, or diagrams to represent patterns and relations. Students investigate which dart length has the best...
Curated OER
Round and Round and Round We Go!
Students investigate motion using a CBL. In this algebra instructional activity, students collect and graph data on a coordinate plane. They define and identify amplitude and period of conic graphs.
Curated OER
Finding a Line of Best Fit
Pupils engage in the practice of creating a scatter plot with the data obtained from measuring different resting heart rates. The data is used to create the table that is translated into a graph. The lesson gives instructions for the use...
Curated OER
Eye Color
Students take a survey on eye color and plot their findings into a graph. In this eye color lesson plan, students take a class survey of everyone's eye color and learn how to put those findings into a graph.
Curated OER
Creating a Spreadsheet
Students create a spreadsheet using ICT. In this algebra lesson, students collect and graph their data using a spreadsheet. They find solution to a given problem using trial and error.
Curated OER
And the Survey Says...
Learners use technology to input, retrieve, organize, manipulate, evaluate, and communicate information; apply appropriate technologies to critical thinking, creative expression, and decision-making skills. They collect and explore data...
Curated OER
Newton's 2nd Law of Motion
Students investigate how mass affects the speed of an object. In this physics lesson, students record data on the data table and graph results. They analyze findings and formulate a conclusion.
Curated OER
Ratios
Sixth graders investigate the concept of ratios and how they can be used to represent the comparison of quantities. The lesson is taught using a table or graph to compare two categories of data.
Curated OER
Don’t Sit Under the Apple Tree…You Might Become Famous
Students explore Newton's laws using CEENBoTs. In this physics lesson, students collect data and create tables and graphs. They calculate speed, acceleration and forces using mathematical formulas.
Curated OER
Exploring Exponential Growth and Decay Functions
Pupils differentiate between exponential growth and decay. In this algebra lesson, students solve exponential equations using properties of exponents. They use the Ti calculator to graph and analyze their functions.
Curated OER
Highs and Lows
Solve problems using integration and derivatives. By using calculus, learners will analyze graphs to find the extrema and change in behavior. They then will identify the end behavior using the derivatives. Activities and handouts are...
Curated OER
Endangered Species
Ninth graders graph data in order to compare the number of extinct species and a rise in human population. They analyze the data collected. Students are encouraged to infer the relationship.


