Curated OER
Pumpkin Seed Experiment
In this unique lesson students participate in a pumpkin seed experiment. Students interact with the pumpkins weight, seeds and record their findings of what lies within the pumpkin once the top of the pumpkin is cut off for observations....
Curated OER
For The Birds
Seventh graders list the features of an ecosystem and identify local bird species. In this bird lesson students work in groups to formulate a hypothesis and test their theory by collecting and analyzing data.
Curated OER
Ohio Census 1990 and 2000
Students explore the Ohio census numbers in 1990 and 2000. In this social studies lesson, students use the census data to answer questions.
Curated OER
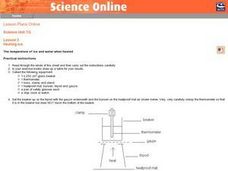
Heating Ice: The temperature of ice and water when heated
Seventh graders read and follow the instructions on the worksheet. They make a table of their results. Students use about 100 cm^3 of water and ice mixture. They heat the water/ice with a Bunsen burner. Temperature is recorded every 30...
Curated OER
Getting to Know the Thirteen Colonies
Fifth graders analyze information about the thirteen colonies. Using the information, they can manipulate and identify a region in which the colony is located. As a class, they make generalizations about the various regions and time...
Curated OER
Integrated Social Studies and Math Lesson
Fourth graders study the American Civil War. They read and analyze information regarding the casualties of the Civil War, fucusing on Indiana soldiers. They graph the information and then write in their reflective journals responding...
Curated OER
Jumping in the Air - What was your Height?
Students solve equations using the quadratic formula. In this quadratic equations lesson, students use digital cameras to film students jumping and import film clips into a computer. Students use the data in the quadratic formula...
Curated OER
Linear Functions
Students solve and graph linear equations. In this algebra instructional activity, students collect data and plot it to create a linear function. They identify the domain and range of each line.
Curated OER
Rate of Solution
Eighth graders determine the amount of agitation necessary to dissolve various sized sugar particles. This task assess students' abilities to collect, organize, and interpret data, create appropriate graphs, predict future events based...
Curated OER
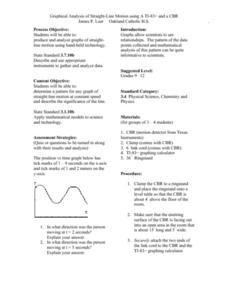
Graphical Analysis of Straight-Line Motion
Students investigate the concept of straight line motion. They determine the pattern and graph it looking for the motion maintained at a constant speed. Students also write a description of the significance of the line. The skill of...
Curated OER
Building Storm Shelters
Sixth graders explore area and perimeter. In this online interactive area and perimeter lesson, 6th graders investigate why the perimeter of rectangles can vary considerably even when the area is held constant. Students construct...
Curated OER
Favorite Farm Animals
Students perform a study of farm animals and their babies. They compile a graph of their favorite farm animals. They utilize a spreadsheet worksheet which is imbedded in this plan.
Curated OER
Design-A-Room Project (Part 3 of 3)
Students culminate a unit on measurement with a focus on area and perimeter. They design a floor plan of their dream room on graph paper showing the proper area and perimeter. They plan the budget for their room and make a 3-D scale...
Curated OER
Little Red Corvette
Students investigate the acceleration of a car. In this acceleration of a car lesson, students make a scatter plot of corvette acceleration data. Students find a model to fit the data by taking the integral of the curve created by the...
Curated OER
Understanding Equations of Functions
Students write equations for different functions. In this algebra lesson plan, students observe data and find the function that goes along with that data. The identify the line of best fit.
Curated OER
Introducing Temperature Measurement
Students explore temperature and use Celcius thermometers to measure and graph the temperature in the classroom daily. They estimate what they think the temperature might be and then find the actual temperature in the room.
Curated OER
Direct and Inverse Variation
Eighth graders participate in two data collection activities that involve direct and inverse variation. In the pre-assessment, 8th graders categorize numerical, graphical, and verbal representations as linear or nonlinear and determine...
Curated OER
Using the Production Possibilities Frontier
Students identify the purpose of models and why economists use them. Using a graph, they practice reading and plotting points. They are introduced to a production possibilities frontier and draw their own from data supplied to them on...
Curated OER
Collect the Weather Lesson Plan
Students explore the weather. In this weather spreadsheet instructional activity, students keep track of weather patterns as they use instruments and resources to chart the data the collect in spreadsheet form.
Curated OER
Making Connections
Seventh graders relate patterns with higher math. In this 7th grade math lesson, 7th graders analyze different methods of portraying data. They relate the data to real life scenarios.
Curated OER
Lesson 3: Life Cycle of Brassica Plants
Students investigate the life cycle of brassica plants. In this science lesson, students observe each stage in the life cycle of their plant. Students record their observations and graph the data. Students
Curated OER
The Box Problem
Pupils create graphic, algebraic and verbal ideas of functions. In this algebra lesson, students graph functions and identify the zeros of the functions. They find the domain and range and classify functions as relation or not.
Curated OER
Patterns of International Tourism in Canada
Students retrieve data on the number of international tourists to Canada, analyzing the seasonal patterns and long-term trends for each region in Canada. They retrieve statistical data from E-STAT; and explain the effect of seasonal...
Curated OER
Predator/Prey Relationship
Students study and analyze data collected on the relationship between the snowshoe hare and lynx in Canada over a 28 year period and create a graph. Students also write a response to a proposal to reduce the lynx population.


