Big Kid Science
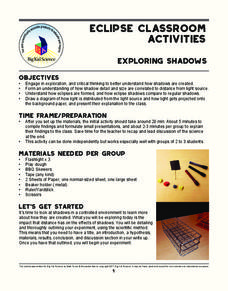
Exploring Shadows
What's that lurking in the shadows? An activity that demonstrates how eclipses happen. Science scholars investigate how light and distance interact to form shadows. The experiment uses simple materials to generate data and observations...
Curated OER
Dental Arithmetic: Sugar Clocks
Students analyze data about their teeth. For this data collection lesson, students determine how often their teeth should be brushed during the day. Students also estimate the amounts of sugar in 17 foods.
Purdue University
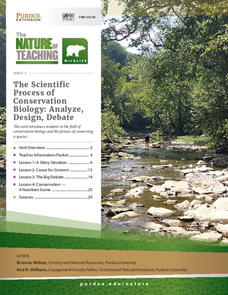
The Scientific Process of Conservation Biology: Analyze, Design, Debate
Scientists use data to learn about species survival—and your classes can too! A set of four lessons guides learners through a process to draw conclusions about the fluctuations in the population of the Hellbender species. They read...
Curated OER
Gathering Statistics for Research
Students gather statistics to include in their research. In this statistics lesson, students investigate how to incorporate statistics into research and other readings besides math. They collect data based on other topics, analyze the...
Yummy Math
Steep Hikes
Grab your hiking gear and get ready for a math adventure! Learners explore the meaning of percent grade change, as compared to the slope in an excellent worksheet activity about hiking trails in the mountains of New Hampshire. They...
Balanced Assessment
Stock Market
Analyze trends in the stock market using histograms. Future economists use data presented in a histogram to find periods of greatest increase and decrease. They also draw conclusions about days that would be best to invest.
University of Minnesota
C. elegans and Alcohol
Investigate experimental design through a hands-on exploration. A creative lesson allows learners to design an experiment to monitor the effects of alcohol on the C. elegans worm. After conducting the experiment, individuals analyze...
Serendip
Evolution and Adaptations
Survival of the fittest isn't just for the movies! A five-part lesson explores several different species with known adaptations and analyzes them for their survival strategies. Using both video and research data, scholars draw...
NASA
Analyzing Surface Air Temperatures by Latitude: Student Activity
Explore global temperatures from the comfort of your learning place! Meteorologists analyze surface temperatures and anomalies across different latitudes. Investigators evaluate graphs to find temperature differences and answer questions...
National Wildlife Federation
I Speak for the Polar Bears!
Climate change and weather extremes impact every species, but this lesson focuses on how these changes effect polar bears. After learning about the animal, scholars create maps of snow-ice coverage and examine the yearly variability and...
Curated OER
Comparing Temperatures and Latitudes
Eighth graders collect weather data from a variety of cities at the same latitudes, but on different continents. They organize data using spreadsheet program, generate graphs, and incorporate into a word processing document. Students...
Curated OER
Height versus Shoe Size
Middle schoolers find a correlation between a person's height and his/her shoe size. They have access to entering data into lists on a graphing calculator and can complete scatter plots. Students read and interpret a scatter plot and use...
Curated OER
Mean and Standard Deviation
Get two activities with one lesson. The first lesson, is appropriate for grades 6-12 and takes about 20 minutes. It introduces the concept of measures of central tendency, primarily the mean, and discusses its uses as well as its...
Curated OER
Graphing Pendulum Results
Sixth graders set up a pendulum experiment deciding which variable to manipulate (length of string or weight on the string). They create a hypothesis, collect necessary equipment, and write out each step of their experiment. They then...
Curated OER
How Alike Are We?
Fourth graders find the range, mode, median, and mean for each of the data sets (height and shoe size). They discuss which measure of central tendency for each data set best represents the class and why. Students graph the shoe size and...
Curated OER
Is there Treasure in Trash?
More people, more garbage! Young environmentalists graph population growth against the amount of garbage generated per year and find a linear model that best fits the data. This is an older resource that could benefit from more recent...
WK Kellogg Biological Station
Plotting Phenology
Finally, a worksheet that involves more than filling in some blanks. Your budding ecologists must graph and analyze three sets of data, then synthesize the information as they think about the impacts of plant reproduction on insects and...
Curated OER
Application and Modeling of Standard Deviation
The first activity in this resource has learners computing the mean and standard deviation of two different data sets and drawing conclusions based on their results. The second activity has them using a dice-rolling simulation to...
Curated OER
Endangered Species
Ninth graders graph data in order to compare the number of extinct species and a rise in human population. They analyze the data collected. Students are encouraged to infer the relationship.
Curated OER
Let the Sunshine In
Ninth graders conduct an experiment which demonstrates the absorption and reflection of sunlight by measuring the heat flow through various window coverings. They predict the relative amount of the sun's heat. Students draw conclusions...
Curated OER
Which Fish Where?
Here is a lesson outline that prompts elementary pupils to graph and analyze data regarding fish caught along the Hudson River. They will review vocabulary and complete 2 worksheets which can be accessed by clicking on the provided links.
Curated OER
Mathematics of Fair Games
Students examine mathematicians' notion of fairness in games of chance. They work in pairs to perform three different experiments using macaroni and paper bags. They record their results on charts and compare their data.
Curated OER
Scattered About
Students are introduced to the concept of scatter plots after reviewing the various types of graphs. In groups, they analyze the type of information one can receive from a scatter plot and identify the relationship between the x and y...
Curated OER
Simple Machines
Fourth graders investigate and explore the inner workings of objects that help us do work. They examine how the parts work together to make the object function. Using the internet, 4th graders discover the interaction of the parts of a...


