Curated OER
Pick's Theorem
Learners investigate polygons and their lattice. In this calculus lesson, students record data using different methods. They analyze their data and draw conclusions based on the relationship between the area and the interior lattice.
Curated OER
Census and Gold Rush Town
Students analyze data and form a mental picture of the make up of a gold rush town. They explain social life in a gold rush town. They use online sources to see paintings of camp life and read accounts of miners' lives.
Curated OER
Venn Diagram and UK Basketball
Students analyze data and make inferences. In this algebra lesson, students collect and analyze data as they apply it to the real world.
Curated OER
Backyard Birds: Who's Who Out There?
Learners practice techniques of field observation and data-gathering while studying local bird population, describe ecosystem as complex combination of elements, which can affect or be affected by each other, and determine effects of...
Curated OER
What is That White Stuff?
Fifth graders identify, through experimentation, what properties of substance are, determine what variables tested will be, identify constants and variables of experiment, conduct experiment to conclusion with measurable, recorded...
Curated OER
Population Pyramids
Students work with and make population pyramids. In this population pyramid lesson plan, students use census data to make population pyramids for China, India, and the United States. They use the information to determine why jobs are...
Curated OER
Crunching the Numbers on Dating Violence
Students read about potential violent relationships and beliefs about dating. For this relationship lesson students use graphs to examine data about healthy realtionshipsand draw conclusions on their results.
Curated OER
Effects of Environment on Memory
Learners explore the effect that environment has on memory. They analyze their own study habits and draw conclusions about their work behaviors. Baseline capacity is established for the subjects' ability to memorize an increasing series...
Curated OER
I'm Late, I'm Late, for a Radioactive Date!
Through the use of an interactive Web site, students explore C-14 and C-14 dating. Then students analyze an article written about the C-14 dating of the Shroud of Turin and draw conclusions.
Curated OER
Environment: Wild Wind Direction
Learners examine the different types of wind patterns. Using common materials, they construct weather vanes to measure and record wind direction over a two-week period. After analyzing the data, they draw conclusions about the...
Curated OER
What's in the Water?
Fifth graders use the dots to simulate water pollutants in a lake. They use cups to collect a sample of "water." Students sort the dots by color and record the number of each dot color under the correct pollutant name in the Lake Water...
Curated OER
Statistics with State Names
Students analyze the number of times each letter in the alphabet is used in the names of the states. In this statistics lesson, students create a stem and leaf plot, box and whisker plot and a histogram to analyze their data.
Curated OER
What Plants Need in Order to Survive and Grow: Light
Students conduct an experiment to evaluate whether plants need light to survive and grow. They observe and gather data about plant responses to different growth regimes, analyze the data, and make conclusions about basic plant needs.
Curated OER
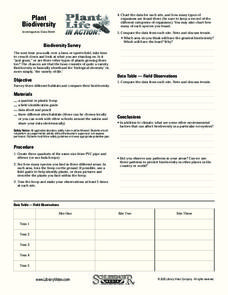
Plant Life in Action
Sixth graders examine various habitats and record the living creatures they found. In this biodiversity lesson, 6th graders complete a worksheet recording their observations. Students draw conclusions about the climate and its effect on...
Curated OER
Climate Change
Students compare weather data and draw conclusions. In this climate change lesson plan, students determine whether data collected over a period of ninety years shows a warming trend.
Curated OER
Polluting the Environment
Fourth graders construct mini-ecosystem, pollute the ecosystem, observe, collect, and record data on the effects of these pollutants on their ecosystem, organize data on spreadsheets, create graphs, and design presentations to share with...
Curated OER
Diffusion
Students design and carry out an experiment according to the scientific method. The experiment must test the effects of time and concentration on the rate of diffusion of potassium permanganate into potato cubes. After performing the...
Curated OER
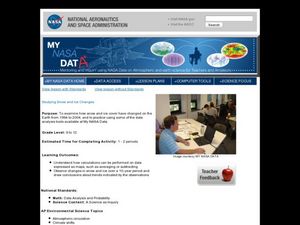
Studying Snow and Ice Changes
Students compare the change in snow and ice over a 10 year period. In this environmental science lesson, students use the live data on the NASA site to study and compare the monthly snow and ice amounts on a map of the entire Earth. ...
Curated OER
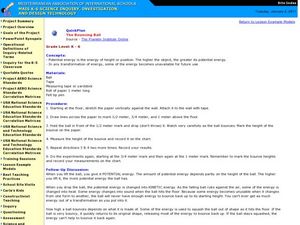
The Bouncing Ball
Students use the scientific method to conduct an experiment to test how a ball bounces. In this inquiry-based physical science and scientific method instructional activity, students drop a ball from specified heights and record the...
Curated OER
Graphs
Students explore graphs and define the different ways they are used to display data. In this algebra lesson, students collect data and plot their data using the correct graph. They draw conclusions from their graphs based on their data.
Curated OER
Analyzing the Job Market for Babysitting in Your Neighborhood
Middle schoolers conduct research on a neighborhood in Canada. In this data analysis lesson, students use data from the 2006 Canadian census to draw conclusions about a population group.
Curated OER
Investigating Factors That Affect Rate of Enzyme Action
Students explore the properties of enzymes. In this chemical reaction lesson, students explore enzymes through a Web-quest and investigative study. Students will collect and summarize data and create a class presentation. This lesson is...
Curated OER
Is There Liquid Water on Mars?
Students assess whether there is liquid water on Mars by analyzing images and data. In this planetary lesson students analyze temperature and pressure graphs and hypothesize about how water could have flowed on Mars.
Curated OER
Urban Effects on Inshore Plankton
Learners investigate the effects of urban pollution on plankton. In this plankton and pollution lesson plan, students use samples of plankton collected in urban areas to observe the effects of pollution on plankton samples. They...


