Curated OER
Climate Change
Students compare weather data and draw conclusions. For this climate change lesson plan, students determine whether data collected over a period of ninety years shows a warming trend.
Curated OER
Polluting the Environment
Fourth graders construct mini-ecosystem, pollute the ecosystem, observe, collect, and record data on the effects of these pollutants on their ecosystem, organize data on spreadsheets, create graphs, and design presentations to share with...
Curated OER
Diffusion
High schoolers design and carry out an experiment according to the scientific method. The experiment must test the effects of time and concentration on the rate of diffusion of potassium permanganate into potato cubes. After performing...
Curated OER
Student - Designed Density Experiment and Poster
In this student-designed experiment worksheet, students decide on an experimental problem to solve. Students use the scientific method to perform an experiment and record the data. Students calculate the density of liquid used in the...
Curated OER
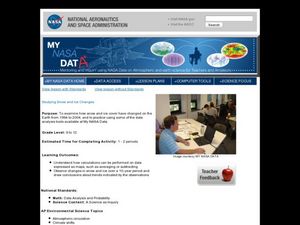
Studying Snow and Ice Changes
Students compare the change in snow and ice over a 10 year period. In this environmental science lesson, students use the live data on the NASA site to study and compare the monthly snow and ice amounts on a map of the entire...
Curated OER
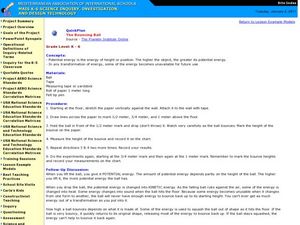
The Bouncing Ball
Students use the scientific method to conduct an experiment to test how a ball bounces. In this inquiry-based physical science and scientific method lesson, students drop a ball from specified heights and record the rebound, then record...
Curated OER
Graphs
Students explore graphs and define the different ways they are used to display data. In this algebra lesson, students collect data and plot their data using the correct graph. They draw conclusions from their graphs based on their data.
Curated OER
Analyzing the Job Market for Babysitting in Your Neighborhood
Middle schoolers conduct research on a neighborhood in Canada. In this data analysis lesson, students use data from the 2006 Canadian census to draw conclusions about a population group.
Curated OER
Constellation Tracking
In this constellation worksheet, students pick a constellation to track over time. They measure its altitude and azimuth at least three times. They make an experimental design for their research and plot their data.
Curated OER
How Does the Angle Effect How Fast a Car Will Travel?
In this angle of movement and speed worksheet, students determine at which angle a car will travel the fastest. They test 12 different angles on a toy car and determine from their data which angle is the best for speed.
NASA
The Effects of Sunspots on Climate
In this sunspots and climate change learning exercise, learners use a diagram of a tree stump and its rings to determine the age of the tree. They use sunspot data from the internet and they construct an Excel spreadsheet to compare the...
Curated OER
Investigating Factors That Affect Rate of Enzyme Action
Students explore the properties of enzymes. In this chemical reaction lesson, students explore enzymes through a Web-quest and investigative study. Students will collect and summarize data and create a class presentation. This lesson is...
Curated OER
Is There Liquid Water on Mars?
Students assess whether there is liquid water on Mars by analyzing images and data. In this planetary lesson students analyze temperature and pressure graphs and hypothesize about how water could have flowed on Mars.
Curated OER
Urban Effects on Inshore Plankton
Students investigate the effects of urban pollution on plankton. In this plankton and pollution lesson plan, students use samples of plankton collected in urban areas to observe the effects of pollution on plankton samples. They...
Curated OER
Health Care
Learners analyze information and draw conclusions about the reality of human life expectancy; the battle between health care technology and our own internal time clocks. Students answer questions such as "Why does aging occur and can...
Curated OER
Meet Your Partners
Students become student scientists and work with Internet partners to collect, share, and analyze data needed to draw conclusions about the Waipi'o Valley Stream Restoration.
Curated OER
Tides & Lunar Cycles
Students demonstrate how the moon affects the tides, a neap tide, and spring tides by using their bodies as models. After students observe the model they created, they draw and label the diagram on a provided worksheet. They then log...
Curated OER
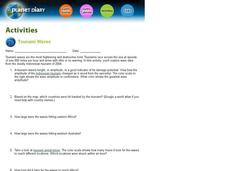
Tsunami Waves
In this tsunami waves worksheet, learners explore data from the Indonesian tsunami of 2004 and answer ten questions about the data. They draw conclusions about the devastation and destruction based on the amplitude and speed of the tsunami.
Curated OER
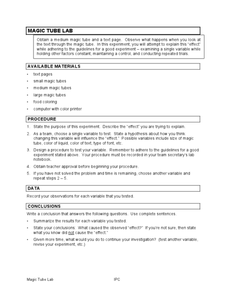
Magic Tube Lab
In this scientific investigation activity, students use "magic tubes" to make observations, hypothesize, study variables in experiments, write procedures, and draw conclusions.
Curated OER
Dripping Wet or Dry as a Bone?
Students use a sponge and water model to explore the concept of relative humidity and create a percent scale. They define humidity and saturation, build a simple humidity/saturation model, collect, predict and interpret data, and create...
Curated OER
Levers
Fifth graders participate in a review discussion of the parts of a lever, resistance or load, fulcrum, and effort. Next, they complete activities at six experiment stations while collecting data that they share with the class. While...
Curated OER
Graphing Surveys
Students collect data and graph it. In this algebra lesson plan, students create a survey for their classmates and teachers. They analyze the results from the survey and graph it. They draw conclusion from their data based on the graph.
Curated OER
Gas Laws and Alka-Seltzer Rockets
Students investigate the Ideal Gas Law. In this three states of matter lesson, students create Alka-Seltzer rockets using film canisters. Students record observations and data according to the scientific method and explain the gas...
Curated OER
How Many Is Too Many?
Learners explore the population explosion. They view a video depicting the exponential growth of human population. Students research the internet to project future population data. They perform hands-on, multimedia activities to study...


