Curated OER
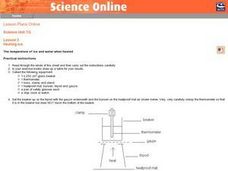
Heating Ice: The temperature of ice and water when heated
Seventh graders read and follow the instructions on the worksheet. They make a table of their results. Students use about 100 cm^3 of water and ice mixture. They heat the water/ice with a Bunsen burner. Temperature is recorded every 30...
Curated OER
Mean and Median
Students identify the different central tendencies. In this probability lesson, students create the correct type of graphs to analyze their data. They make predictions and draw conclusions from their data.
NOAA
Deep-Sea Ecosystems – A Tale of Deep Corals
Many have debated which came first, the chicken or the egg, but this lesson debates which came first, the hydrocarbons or the carbonate reef. After a discussion on deep-sea corals, scholars receive a set of questions to research and...
Curated OER
Pyramid of Biomass
Pupils interpret data to demonstrate biomass and number pyramids. They use information to draw conclusions and examine an example of biological magnification.
Alabama Learning Exchange
Teaching the Scientific Method
Eighth graders watch a PowerPoint presentation that focuses on the scientific method including developing a hypothesis. They examine how to perform a scientific experiment using a method that maintains its validity, collect and use the...
NTTI
Vectors: Traveling, But in What Direction
High schoolers watch a video of real-world situations regarding speed, direction, velocity, force, etc. and answer questions while viewing. They then practice drawing and using vectors to solve more real-world problems.
Curated OER
Make a Solar Sill
Students design a solar still and purify water. In this earth process and design activity, students observe how the heat of the sun helps to purify water. Students analyze why this could be helpful on a desert island. ...
Curated OER
HYPOTHESIZE THIS!
Students predict, measure, collect, and analyze data to investigate heat loss in water and in air.
Curated OER
Checking Test Comparability/Scattergrams
Young scholars construct a scattergram graph. In this statistics instructional activity, students graph data by hand and using a spreadsheet program. They establish lines of best fit and draw conclusions using their graphs.
Curated OER
Line of Best Fit
Students calculate the equation of the line of best fit. In this statistics lesson, students create scatter plots and find the line of best fit going through their data. They make predictions and draw conclusions.
Curated OER
Riparian Buffers
Learners research the roles of riparian buffers and create a model that shows the role of the buffers in protecting waterways from pollution. They conduct an experiment from which they record their data in this unit which is spread over...
Curated OER
Reading Graphs
Students read graphs and charts to interpret results. In this algebra lesson, students interpret bar, line and pictographs. They draw conclusions and make predicitons based on these charts.
Curated OER
How Does a Spring Scale Work?
Students create visuals of the effect of a spring scale. In this algebra lesson, students use the navigator to graph the effects created by a spring scale. They draw conclusion from the graph.
Curated OER
What Is Viscosity?
Students experiment with the visocosity of corn syrup, mineral oil, vegetable oil, water, and honey. They research viscosity before beginning. Pupils draw the conclusion that the marble sinks more slowly in the liquids with greater...
Classroom Law Project
What does the Constitution say about voting? Constitutional Amendments and the Electoral College
As part of a study of voting rights in the US, class members examine Constitutional amendments connected with voting and the role of the Electoral College in the election process.
Code.org
Packets and Making a Reliable Internet
That's not what I said! My message did not arrive in the correct order! Introduce the concept of packets and the transmission control protocol used to send and receive information over the Internet. The class participates in an...
Curated OER
Draw an Alien in Natural Habitat
Students apply prior knowledge of living things, structures of living things and how living things sense and respond to their environment. In this habitat lesson, students review the basic needs of organisms to survive. Students create...
Curated OER
Introduction to Inverse Functions
Students investigate patterns of inverse functions. In this algebra instructional activity, students represent functions with the calculator and on paper. They analyze their data and draw conclusions.
Curated OER
Probability
Sixth graders explore the concept of probability. In this probability lesson plan, 6th graders collaborate to collect spinner data based on the likelihood of spinning odd and even numbers. Students complete 2 other probability activities...
Curated OER
The Mathematics of Space and Place
Students investigate the measurements and geometry of the school grounds. They conduct inquiry while measuring the campus and some of the city blocks. Then students draw a map to scale and categorize property types using a pie graph.
Curated OER
Sampling Distributions
Students analyze sampling from different population. In this statistics lesson, students define the meaning of sample sizes and what causes an increase or decrease. They graph their data on the Ti calculator and draw conclusion from the...
Curated OER
Gender Issues through Chi-square Experiments
Students investigate teachers and gender preference. For this statistic lesson, students collect data of teachers calling on students to see if they are calling on one gender more than the other. Students examine the data and draw...
Curated OER
Farmers, the Populist Party, and Mississippi (1870-1900)
Students determine the cause and effect of a historical event. They draw conclusions about statistical data and maps and compose a campaign speech for a Populist candidate. They design a political poster and badge for the Populist Party.
Curated OER
Acidity of Soda Pop
Students conduct an experiment to determine the acidity of three different brands of soda by adding a known volume of base until a pink color appears in the reaction vessel. They test fresh and flat soda, observe any differences, and...


