Concord Consortium
Gestation and Longevity
Is the gestation length of an animal a predictor of the average life expectancy of that animal? Learners analyze similar data for more than 50 different animals. They choose a data display and draw conclusions from their graphs.
Howard Hughes Medical Institute
Got Lactase? Blood Glucose Data Analysis
Many physicals include a blood glucose test, but what are doctors actually testing? Scholars graph and interpret blood glucose data, allowing them to observe the differences in lactase persistence and draw conclusions. They then connect...
Curated OER
Collecting Data and Graphing
Young mathematicians collect data and graph it. They work collaboratively to collect data regarding the span of arm length versus height and graph the data they collect.
Curated OER
The Dog Days of Data
Students practice an alternative form of data presentation. They practice sequencing data, identifying the stem-and-leaf, creating stem-and-leaf plots, and drawing inferences from the data by viewing the plots.
Curated OER
The Dog Days of Data
Young scholars are introduced to the organization of data This lesson is designed using stem and leaf plots. After gather data, they create a visual representation of their data through the use of a stem and leaf plot. Students...
Curated OER
Dealing With Data
Young scholars collect, organize, and display data using a bar graph, line graph, pie graph, or picture graph. They write a summary describing the data represented and compare the graph to another graph in the class.
Curated OER
Raisin the Statistical Roof
Use a box of raisins to help introduce the concept of data analysis. Learners collect, analyze and display their data using a variety of methods. The included worksheet takes them through a step-by-step analysis process and graphing.
Curated OER
Seeing Is Believing
Students investigate the concepts of probability. They use data to find the central tendency, median, and mode. Students design and play a game in order to practice the concepts. They also complete a table with data that is analyzed.
Curated OER
Fire Wars
Your class can practice collecting and analyzing data. They extrapolate information and derive data from fire season statistics. They also choose the most appropriate format to display collected data.
Curated OER
What is the Average Height of Your Class?
In this statistics lesson plan, learners use an on-line form generator create a class-specific form, then complete the form, view a graph and data analysis, and draw conclusions.
Curated OER
Graphing It Daily
Students identify and demonstrate a positive learning attitude and use basic concepts and skills. Learners also communicate clearly in oral, artistic, written, and nonverbal form. Finally, students participate in the daily data...
Curated OER
Mathemafish Population
It's shark week! In this problem, young mathematically minded marine biologists need to study the fish population by analyzing data over time. The emphasis is on understanding the average rate of change of the population and drawing...
Curated OER
Survey of Height
In this data collection worksheet, students survey the heights of their fellow classmates, organize their data in a data table, and create a bar graph from their data. Once bar graph is completed, students complete 2 short answer...
Tennessee Valley Authority
Renewable Energy Sources
Not all energy sources are renewable, as learners investigate in this unit. Made up of six lessons that span a few weeks of instruction, the unit has learners examining US energy reserves and consumption, using data to draw conclusions...
Beyond Benign
Can You Hear Me Now? Cell Phone Accounts
How sustainable are cell phones? Throughout the unit, learners explore the issues around cell phones concerning sustainability. Class members take a graphical look at the number of cell phones across the world using a box-and-whisker...
Howard Hughes Medical Institute
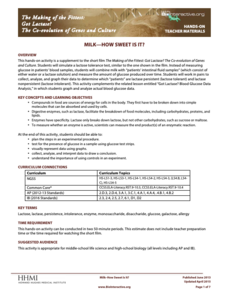
Milk—How Sweet Is It?
Have you ever wondered why some people are lactose intolerant? Participants test simulated patients in a hands-on lab activity to find out! They learn about lactose intolerance by performing an experiment, analyzing data, and drawing...
Curated OER
Probability Experiment Simulation: Design and Data Analysis Using a Graphing Calculator
Seventh graders simulate probability experiments. Using a graphing calculator, 7th graders design, conduct, and draw conclusions from simulations or probability experiments. Students construct frequency tables and compare the...
Curated OER
Data With Candy
Students, while utilizing the classroom and the computer lab with a bag of colored candy, gather and interpret data, calculate averages and draw conclusions and draw a bar graph. They estimate how many candies are in the bag, what...
Curated OER
Jelly Bracelets: Fashion or Sex Game?
Ever-changing fashion fads are the ideal context for an engaging sociology experiment for adolescents. Through research and conducting a survey, learners draw conclusions about the controversial jelly bracelets fad, banned in some...
Curated OER
Fish Communities in the Hudson
Learning to read data tables is an important skill. Use this resource for your third, fourth, or fifth graders. Learners will will study tables of fish collection data to draw conclusions. The data is based on fish environments in the...
Curated OER
"Lucky Charms": Interpreting Data and Making Predictions
Seventh graders determine if a "lucky charm" will increase their chances of winning a game. Students calculate the experimental probability of each player in a game. They observe and collect data from each activity. Students compare the...
NASA
Developing an Investigation
Watch as your class makes the transition from pupils to researchers! A well-designed lesson has scholars pick a solar wind characteristic to research. They then collect and analyze official data from the LANL website. This is the...
Inside Mathematics
House Prices
Mortgages, payments, and wages correlate with each other. The short assessment presents scatter plots for young mathematicians to interpret. Class members interpret the scatter plots of price versus payment and wage versus payment for...
EngageNY
Linear and Exponential Models—Comparing Growth Rates
Does a linear or exponential model fit the data better? Guide your class through an exploration to answer this question. Pupils create an exponential and linear model for a data set and draw conclusions, based on predictions and the...


