Curated OER
The Effect of Dissolved Salt on the Boiling Point of Water
Explore the properties of solutions with a lab activity. Chemistry fans determine the boiling point of water, add salt to create a solution, and then repeat the process four more times. They design their own data table and then graph the...
Cornell University
Energy Changes in Chemical Reactions
The heat of solution measures how much thermal energy a dissolving substance consumes or gives off. The experiment demonstrates both endothermic and exothermic reactions. Scholars dissolve several substances, measure the temperature...
Curated OER
The Solar Cycle
Students research the solar cycle. For this Science lesson, students use the internet to investigate the solar cycle. Students produce a spreadsheet and graph from the information collected.
Curated OER
What Are Erosion and Sediments?
Students create experiments in class based on the erosion of Earth. In this erosion lesson, students perform a lab in class replicating the effects of erosion. Students finally draw their own conclusions based on the research performed.
Curated OER
How to Make a Lake
Students examine the Michigan state quarter and discuss the effects glaciers have on land formation. They perform an investigate using ice cubes and sand to show how glaciers have carved the land.
Pennsylvania Department of Education
Adding and Subtracting Three-Digit Numbers by Jumping
Second graders use data to graph information and draw conclusions. For this lesson on data analysis, 2nd graders practice gathering, sorting, comparing, and graphing data. Students differentiate data that can and cannot change over time.
Curated OER
Designing a Speedometer
In this algebra worksheet, students analyze the designs of a speedometer. They collect data on the distance and time as the speedometer works. They draw conclusion and make predictions from the collected data. There are 4 word problems.
Curated OER
Cloudy vs. Clear
Students analyze line plots. For this weather lesson using real NASA data, students discuss how weather affects the way the Earth is heated by comparing different line plots.
Curated OER
March of the Polar Bears: Global Change, Sea Ice, and Wildlife Migration
Students study global change and how these changes impact wildlife. In this polar bears lesson students analyze maps and data to understand climate change.
Curated OER
Human Effect
Students investigate changes in air quality. In this science lesson, students compare data to determine the air quality. Students explore how humans affect the air quality.
Curated OER
Coming to America: U.S. Immigration
Analyze primary source documents relating the conditions under with prompted American immigration. Learners will analyze information in order to create a six-panel pamphlet. Much of the lesson is not available but the key objectives are....
Inside Mathematics
Vencent's Graphs
I like algebra, but graphing is where I draw the line! Worksheet includes three multiple-part questions on interpreting and drawing line graphs. It focuses on the abstract where neither axis has numbers written in, though both are...
Curated OER
Germination Inhibitors
In germination experiment worksheet, students conduct the following lab activity. Students determine the effects of another tomato on germinating seeds. Students answer the following questions to analyze their experiment.
Curated OER
Science Skills and Experimental Design
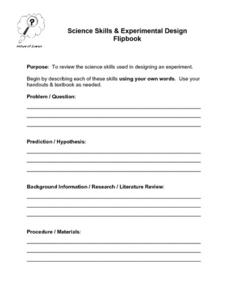
In this experimental design worksheet, students describe the different science skills required when designing an experiment. Then students create a flipbook with the information. This worksheet has 9 short answer questions.
Curated OER
Math:Survey Role-Playing Activity
Students create survey questions to discover why students join clubs. Using sampling methods and question phrasing techniques, they conduct the survey both in and out of school. Once students analyze their survey information, they...
Curated OER
McCadam's Quarterly Report
Fourth graders problem solve a problem from a local business using data, generating graphs, and draw conclusions. They submit their findings in a business letter format with feed back from a company's plant manager.
Curated OER
Unexpected Answers
Students explore and complete a variety of activities demonstration probability. They make observations about the results of the activities. Students complete and discuss conditional probability. Also, students draw conclusions about...
Curated OER
Friction and Inertia
Learners study friction and inertia, make predictions, and compare data. In this investigative lesson students view a demonstration on friction, divide into groups, and complete an activity.
Science 4 Inquiry
At the Top: A Bald Eagle's Diet
Bald eagles are opportunistic predators and eat fish as well as raccoons and other mammals. Pupils learn about bald eagle diets through a simple simulation and videos. They collect and analyze data to understand the adaptability of this...
Kenan Fellows
Lego Thinking and Building
Run a simulated airplane manufacturing plant with your pupils as the builders! Learners build Lego airplane models and collect data on the rate of production, comparing the number produced to the number defective. Using linear...
Curated OER
Science: Her-bariums Galore!
Students collect and identify plant species and construct herbariums both at school and at home. By gathering data from both locales, they draw conclusions and make predictions about plant diversity. Upon completion of the exercises,...
Curated OER
Microbes That Are Your Buddies - Biology Teaching Thesis
Students analyze experimental data and draw conclusions. They are able to comprehend that not all microbes are harmful--they can be helpful to humans. Students are able to comprehend specific examples of cases in which microbes are...
Curated OER
A Closer look at Oil and Energy Consumption
Upper graders analyze basic concepts about the consumption, importation and exportation of the worlds oil production. They create several graphs to organize the data and draw conclusions about the overall use of oil in the world.
Baylor College
Body Mass Index (BMI)
How do you calculate your Body Mass Index, and why is this information a valuable indicator of health? Class members discover not only what BMI is and practice calculating it using the height and weight of six fictitious individuals, but...


