National Council of Teachers of Mathematics
Geogebra: Residuals and Linear Regression
If the line fits, use it. Using a Geogebra interactive, pupils plot points and try to find the best fit line. They assess the linear fit by analyzing residuals. A radio button allows participants to show the regression line and the...
Radford University
Pollution and Curves of Best Fit
Don't put the resource on curves of best fit out on the curb. Using researched data on trash and recycling, scholars create scatter plots and regression curves to analyze the information. As a culminating activity, they complete projects...
Curated OER
Statistics
In this statistics worksheet, students solve 2 problems that involving plotting data, recognizing ordered pairs, and analyzing the graphed relationship.
Curated OER
Does Music Cam the Savage Beast?
Students collect, graph and analyze data. In this statistics lesson plan, students measure the heart beat of a person as they listen to music. They use the CBL and TI to create a graph, analyzing the outcome.
Curated OER
Data Shuffle
Students find an advertisement or newspaper using charts or graphs. They create another graph using the same information in a different format. They write a comparison of the two graphs.
Curated OER
Scatterplots and Regressions
In this scatterplots and regressions instructional activity, students solve 6 different types of problems related to graphing scatterplots and interpreting regressions. First, they create a scatterplot from the given data coordinates and...
Curated OER
Dog Days or Dog Years?
In need of some algebraic fun with real world implications?Learners use ordered pairs, a table of values and a scatter plot to evaluate the validity of several real world data sets. The class focuses on dog ages in human years, domain,...
Curated OER
Scatterplots
In this scatterplots worksheet, students look at 4 graphs and determine the correlation between the data. Students then review 8 scenarios and decided the type of correlation.
Discovery Education
Sonar & Echolocation
A well-designed, comprehensive, and attractive slide show supports direct instruction on how sonar and echolocation work. Contained within the slides are links to interactive websites and instructions for using apps on a mobile device to...
Kenan Fellows
Lego Thinking and Building
Run a simulated airplane manufacturing plant with your pupils as the builders! Learners build Lego airplane models and collect data on the rate of production, comparing the number produced to the number defective. Using linear...
Teach Engineering
Density Column Lab - Part 1
Mass and density — aren't they the same thing? This activity has groups use balance beams and water displacement to measure several objects. The pupils use the measurements to calculate the density of the objects.
Bowland
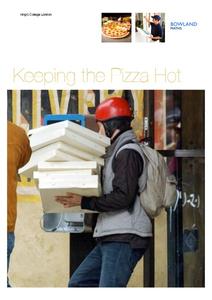
Keeping the Pizza Hot
Learners conduct an experiment to develop a cooling curve for pizza. They consider how this affects pizza delivery in terms of packing material, distance, and delivery routes.
Alabama Learning Exchange
The State Capital of Stem and Leaf
Students explore the concept of stem and leaf plots. In this stem and leaf plots lesson, students plot the 50 US states' capitals on a stem and leaf plot according to the first letter of each state. Students compare their stem and leaf...
Curated OER
Statistics
In this statistics worksheet, students view 6 graphs to determine the correlation. Students then answer 4 questions that involve plotting data, determining a relationship, and making predictions.
Curated OER
Perimeter Pattern
High schoolers investigate perimeter patterns formed by a hexagon and a triangle. They will identify the dependent and independent variable and write a function for the relationship.
Curated OER
Word Problems: "Leaving D.C."
In this solving math story problems worksheet, students read statistics from the Student edition of USA Today to solve word problems. Students solve 6 problems.
Curated OER
Lessen the Loan
Middle-schoolers explore the concept linear equations. They use the internet to navigate through videos and problems. Pupils problem solve to determine rates of change, slope, and x and y-intercepts.
Curated OER
Best Guesser
Fifth graders develop strategies for estimating ages, and illustrate results by graphing and interpreting scatter plots to compare x and y coordinates.
Curated OER
Reaching New Heights
Students explore the relationship between two variables. Students measure their arm span and height. They gather this class data to design a scatter plot. Students interpret the meaning of individual coordinates and the overall graph....
Curated OER
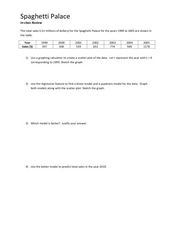
Spaghetti Palace
In this spaghetti palace worksheet sheet, students examine data and create a scatter plot. They use their graphing calculator to find a linear model and a quadratic model for given information. Students predict total sales. This...
Curated OER
Statistical Accuracy and Reliability
Ninth graders assess the accuracy and reliability of current survey data and how it is represented. They design a survey, collect data, and use technology to analyze the data and present the results. Students examine scatter plots and...
Curated OER
M&M Exponential Activity
Students create a scatter plot of their experimental data. In this algebra lesson plan, students use M&M's to determine an algebraic model. They discuss results in class.
Curated OER
The Bigger they Are . . .
Students do a variety of data analyses of real-life basketball statistics from the NBA. They chart and graph rebounding, scoring, shot blocking and steals data which are gathered from the newspaper sports section.
Curated OER
Commercial Salmon Fishing
Students work with data about commercial fishing ofsalmon in Alaska. Students gather data, graph it, and analyze it.


