College Board
2000 AP® Statistics Free-Response Questions
A little communication goes a long way. Free-response questions from the 2000 AP® Statistics exam require pupils to communicate their results—not just perform calculations. The questions ask individuals to explain, discuss, and interpret...
Curated OER
comparison of Two Gender Sports Teams
Learners gather data on sports team and create a box and whisper plot. In this data collection lesson, students find the median, the quartile range, and relationships between variables.
Curated OER
Lesson Plan On Fran Data
Seventh graders investigate the concept of functions and how they are used in the context of the real world while identifying the dependent and independent variables. They graph relations and functions and find the zeros of functions....
Curated OER
Line of Best Fit
Students identify the line of best fit. For this statistics lesson, students collect and analyze data. They calculate the regression equations and identify the different types of correlation.
Curated OER
Penny Toss - Exponential Growth and Decay
In this penny toss worksheet, students collect statistical data by tossing pennies and then create a scatter plot of the data. They use formulas for exponential growth and decay and then plot the function. This two-page document...
Curated OER
Correlate This!
Students investigate different correlations. In this algebra instructional activity, students analyze graphs and identify the lines as having positive, negative or no correlation. They calculate the line of best fit using a scatter plot.
Curated OER
Line of Best Fit
Students calculate the equation of the line of best fit. In this statistics lesson, students create scatter plots and find the line of best fit going through their data. They make predictions and draw conclusions.
Curated OER
Little Red Corvette
Young scholars investigate the acceleration of a car. In this acceleration of a car lesson, students make a scatter plot of corvette acceleration data. Young scholars find a model to fit the data by taking the integral of the curve...
Curated OER
Lab Sheet: Exponential Growth and Decay
For this exponential worksheet, students gather information from an experiment and plot the data in a scatter plot. Using given formulas, they plot an equation of a line and then compare the graphs. Students observe exponential growth...
Curated OER
Batteries in Series
Eighth graders examine batteries in a series circuit and the associated voltage. They determine, through inquiry and problem solving, that the total voltage of batteries in a series is the sum of the voltage of each battery. They design...
Curated OER
Modeling Population Growth
Students collect data on population growth. In this statistics activity, students graph their data and make predictions. They find the linear regression and the best fit line.
Curated OER
Comparison of Two Different Gender Sports Teams - Part 1 of 3 Measures of Central Tendency
Students gather and analyze data from sports teams. In this measures of central tendency lesson, students gather information from websites about sports team performance. Students analyze and draw conclusions from this data. This lesson...
Curated OER
Precalculus: Function Models for Real-Life Situations
Young scholars use calculators and "by hand" techniques to compare models of real-life data situations, determine the best model for a situation, and use their models to make predictions.
Curated OER
Algebra II: Quadratic Functions
Students collect and organize data, make a scatterplot, fit a curve to the appropriate parent function, and interpret the results. Students translate among the various representations of the quadratic function, formulate equations, use a...
Curated OER
Finding a Line of Best Fit
Pupils engage in the practice of creating a scatter plot with the data obtained from measuring different resting heart rates. The data is used to create the table that is translated into a graph. The lesson gives instructions for the use...
Curated OER
Black Out
Pupils collect and analyze data. In this statistics lesson, students plot their data on a coordinate plane and find the line of best fit. They calculate the linear regression using the data.
Curated OER
Histograms and Statistical Graphics
In this statistics worksheet, students solve 6 data problems. They construct a histogram of given data, they create a frequency polygon, and a stem and leaf diagram. Students create a dot plot and a pie chart for given data sets. On the...
Curated OER
Explanatory and Response Variables
In this explanatory and response variables worksheet, students answer 4 problems surrounding variable relationships and outliers. Student must construct a scatter plot.
Curated OER
The Closer I Get To You
Pupils explore the law of reflection. Through experimentation and problem solving, they collect and analyze data pertaining to reflection. The data is plotted on a graph and formulas for calculating the x and y values are evaluated.
Curated OER
Understanding Equations of Functions
Students write equations for different functions. In this algebra lesson, students observe data and find the function that goes along with that data. The identify the line of best fit.
Curated OER
Conductivity of salt Solutions
Students investigate the concentration level of solutions. In this math/science lesson, students identify three different ionic compounds. They predict the conductivity of each using their collected data.
Curated OER
Color Me Hot
Seventh graders use the scientific method, to observe, record and analyze the data they gathered. They make observations using their five senses. Students compare, contrast and draw conclusions based on the observations and data...
Curated OER
Quadratic Modeling Of Canada's Baby Boom
Students model quadratic equations. In this algebra lesson, students are given data to graph using a function. They investigate vertex and transformation of quadratic functions.
Curated OER
Analyzing Cubes
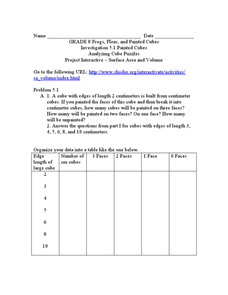
For this analyzing cubes worksheet, 9th graders solve and complete 6 different types of problems. First, they organize the given data into the table provided. Then, students study the patterns in the table and tell whether the pattern of...


