Curated OER
Scatterplots
In this scatterplots worksheet, students look at 4 graphs and determine the correlation between the data. Students then review 8 scenarios and decided the type of correlation.
Teach Engineering
Density Column Lab - Part 1
Mass and density — aren't they the same thing? This activity has groups use balance beams and water displacement to measure several objects. The pupils use the measurements to calculate the density of the objects.
Curated OER
Statistics
In this statistics worksheet, students view 6 graphs to determine the correlation. Students then answer 4 questions that involve plotting data, determining a relationship, and making predictions.
Curated OER
Word Problems: "Leaving D.C."
In this solving math story problems worksheet, students read statistics from the Student edition of USA Today to solve word problems. Students solve 6 problems.
Curated OER
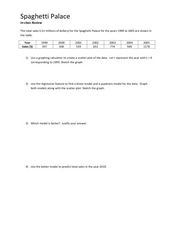
Spaghetti Palace
In this spaghetti palace worksheet sheet, students examine data and create a scatter plot. They use their graphing calculator to find a linear model and a quadratic model for given information. Students predict total sales. This...
Curated OER
Commercial Salmon Fishing
Students work with data about commercial fishing ofsalmon in Alaska. Students gather data, graph it, and analyze it.
Virginia Department of Education
Exponential Modeling
Investigate exponential growth and decay. A set of six activities has pupils collecting and researching data in a variety of situations involving exponential relationships. They model these situations with exponential functions and solve...
Firelands Local Schools
Exponential Growth and Decay
How can you safely model exponential growth and decay? A hands-on activity uses candies to model not only exponential decay, but also exponential growth. Exponential equations are fitted by hand and by use of a calculator to the data...
Curated OER
Graphs
In this graphs worksheet, students solve and complete 9 various types of problems. First, they use a large scatter graph to complete a described trend in data. Then, students find the difference of negative numbers and place them in...
Curated OER
Coffee and Crime
Is there a correlation between the number of coffee shops and the amount of crime in a given area? In this quick exercise, your class will examine the data, interpret the results, and discuss their conclusion. Concepts covered include...
Curated OER
Statistics
In this statistics activity, students solve and complete 2 different problems that include using statistics. First, they use the scatterplot shown to determine the value of x that best matches the expression. Then, students determine the...
Curated OER
Scatterplots
In this scatterplots worksheet, students construct a scatter plot from a given data set. Students then answer 4 questions regarding the least-squares regression line and making predictions.
Curated OER
Scatter Graphs
In this scatter graphs worksheet, students learn a way of illustrating information about two related values. Students complete 30 questions about the graphs. Note: One of the graphs has English pounds. This is intended as an online...
Curated OER
Business & Statistics: Final Exam
In this business and statistics worksheet, students read real-life business problems, arrange data, and identify the probability method best used to determine the answer. They identify the type of random sample, draw stem-and-leaf plots,...
Curated OER
Strike a Pose: Modeling in the Real World (There's Nothing to It!)
Adjust this instructional activity to fit either beginning or more advanced learners. Build a scatter plot, determine appropriate model (linear, quadratic, exponential), and then extend to evaluate the model with residuals. This problem...
Curated OER
Super Bowl Champs
In this Super Bowl worksheet, students create line plots of all winners and losers of the Super Bowl. They create stem-and-leaf plots, scatter plots, and bar graphs of football data. This one-page worksheet contains 5 multi-step problems.
Curated OER
Scientific Observation of Force and Acceleration on an Object
In this force and acceleration worksheet, 8th graders answer ten questions based on two graphs. The first graph is a scatter plot, the second is a line graph.
Curated OER
Penny Toss - Exponential Growth and Decay
In this penny toss worksheet, students collect statistical data by tossing pennies and then create a scatter plot of the data. They use formulas for exponential growth and decay and then plot the function. This two-page document...
Curated OER
Lab Sheet: Exponential Growth and Decay
For this exponential worksheet, students gather information from an experiment and plot the data in a scatter plot. Using given formulas, they plot an equation of a line and then compare the graphs. Students observe exponential growth...
Curated OER
Histograms and Statistical Graphics
In this statistics worksheet, students solve 6 data problems. They construct a histogram of given data, they create a frequency polygon, and a stem and leaf diagram. Students create a dot plot and a pie chart for given data sets. On the...
Curated OER
Explanatory and Response Variables
In this explanatory and response variables worksheet, students answer 4 problems surrounding variable relationships and outliers. Student must construct a scatter plot.
Curated OER
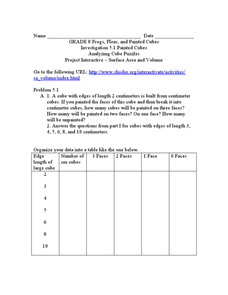
Analyzing Cubes
For this analyzing cubes worksheet, 9th graders solve and complete 6 different types of problems. First, they organize the given data into the table provided. Then, students study the patterns in the table and tell whether the pattern of...
Curated OER
Modelling Periodic Phenomena
In this Pre-calculus/Trigonometry worksheet, students determine the trigonometric function that best models the given data. The eight page worksheet contains explanation, examples, and twenty-one problems. Answers are not included.
Virginia Department of Education
Linear Modeling
An inquiry-based algebra lesson explores real-world applications of linear functions. Scholars investigate four different situations that can be modeled by linear functions, identifying the rate of change, as well as the strength and...


