Curated OER
Charts and Graphs
Fifth graders interpret data into graphs and percentages. In this organizing data instructional activity, 5th graders discuss bar, circle and line graphs. Students complete bar graph and apply probability using the results.
Curated OER
Sweethearts and Data Analysis
Middle schoolers explore the concept collecting and representing data. In this collecting and representing data lesson, students record the different colors of sweetheart candies in their sweethearts box. Middle schoolers create a table...
Curated OER
Favorite Candy Bar Graph
Students decide on six different types of candy bars to include in a data collection activity. Working in small groups, they survey a target group in a set amount of time. They access a Internet based graphing tool to create a bar graph...
Curated OER
Skittle Graphing (Lesson Plan)
Students discuss the uses of graphs. They use color candies to count and sort before designing graphs. They label the graph papers with appropriate titles and candy colors. They complete the graph bars, and discuss the results with a...
Curated OER
Build a Skittles Graph
Students construct a bar graph with a given set of data. They calculate the ratio and percent of the data. Students discuss alternate ways of graphing the data as well as multiple strategies to approach the task.
Curated OER
Gummy Bear Math
First graders predict, collect data, and create a graph based on gummy bear colors they are given. In this graphing lesson plan, 1st graders first predict how many colors of gummy bears there are. They then count the colors, graph them,...
Utah Education Network (UEN)
Candies R Us
A box is fun to make, especially when it's a candy box! These activities help to cement understanding of the difference between surface area and volume. Have individuals measure the surface area of their box in two-dimensions before...
Curated OER
Graphing With Candy
Students gather information and interpret the results using a tally chart, a table, and a bar graph.
Curated OER
Math: Graphs and Their Symbols
Second graders examine different types of graphs and discover the meanings of the symbols used on them. After gathering data about themselves, their communities, and the world, they use that information to create graphs. Among the...
Curated OER
Which Graph is best?
Students use commercial software to organize and visually display data to draw conclusions; students use graphing software to create several types of graphs illustrating the number of each color of M&M's in one bag.
Curated OER
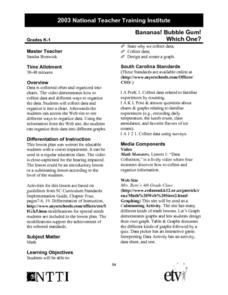
Bananas! Bubble Gum! Which One?
Students design and create a graph of data they have collected on their favorite candy bars. They explore how to organize data as well.
Curated OER
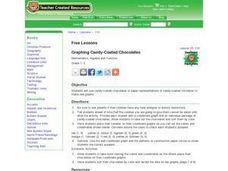
Graphing Candy-Coated Chocolates
Students place pieces of candy on their coordinate graphs as the teacher calls out the colors and coordinates embedded in the plan. The teacher circulates around the class to check each student's answers for accuracy.
Curated OER
Atomic Candy
Mmmmm! Radioactive "candium!" Nuclear physics or chemistry classes use M&M'S® to demonstrate the process of radioactive decay. Individuals pour out a bag of candies and record the number that fall M-side-up to represent the number of...
Curated OER
Cartesian Coordinates
Students investigate rational numbers through data analysis and statistics. For this algebra lesson, students represent, rename, compare and order rational numbers. They collect and represent data correctly on a graph.
Curated OER
Technobiz
Learners examine candy preferences to create a plan in order to improve candy sales. In this technobiz lesson, students build spreadsheet and organizational skills by graphing and calculating data. Learners are introduced to terminology...
Kenan Fellows
Half-Life
Scholars shake their way to understanding half-life with the help of candy. They observe and record which side candy lands on to graph the exponential decay in the fifth lesson of seven integrating chemistry and algebra. Combining...
Curated OER
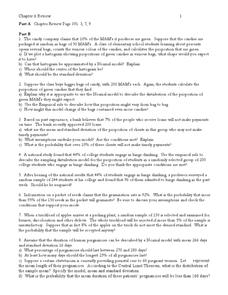
Random Probability
In this statistics and probability worksheet, young statisticians solve and complete 13 different problems related to probability, percentages, and normal distributions. They consider data models, assumptions about the models, and find...
Curated OER
The Candy Color Caper
Students explore the concept of probability. They calculate the probability of an event happening and graph their results. Students determine the probability of winning a sweepstakes. They construct a bar graph to represent all the...
Curated OER
M & Ms in a Bag
Students make predictions about the number and colors of M&M's in a snack size package. They create an Excel spreadsheet to record the data from their small group's bag, create a graph of the data, and discuss the variations of data...
Curated OER
Constant Dimensions
Young scholars explore measuring units by investigating the dimensions of different objects. In this data graphing lesson, students utilize candy, beads and fingers to measure different dimensions of geographic figures. Young scholars...
Curated OER
Sorting Sweethearts
Learners categorize sweetheart candy by color or message. In this sorting and graphing activity, students collect data by sorting the candy and then diagram their results in a graph.
Curated OER
Graphing Using Excel
Fifth graders complete a series of graphs by gathering information and using Excel to graph the information. For this graphing lesson, 5th graders graph favorite desserts of the class. Student put their results into the computer and...
Curated OER
Rock Candy Crystals
Learners discover how rocks are created. In this rock formation lesson, students investigate saturation, evaporation, and phase changes in geology. Learners create rock candy from skewers, string, boiling water and sugar.
Curated OER
Taste the Rainbow
Students practice estimating and graphing by utilizing Skittles. In this statistics lesson, students complete worksheets based on the likelihood of a certain color of skittle coming out of the bag. Students create a graph based on the...


