Curated OER
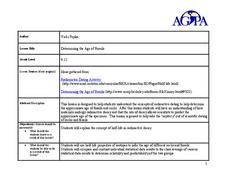
Determining the Age of Fossils
Students examine the concept of radioactive dating. In this radioactive dating lesson, students investigate how to determine the ages of fossils and rocks as they learn about half-life radioactive decay.
Curated OER
Bon Voyage Math
Sixth graders investigate the cost of throwing a party. For this cost of throwing a party lesson, 6th graders have to throw a going away party for 2 exchange students given a $350 budget. Students work in groups to determine the best...
Curated OER
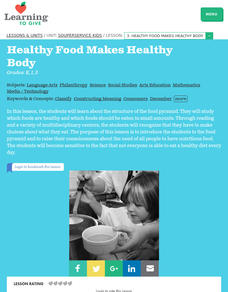
Heathly Foods Makes Heathly Body
Students examine and identify foods on the food pyramid. They catergorize food and place them on the correct level. They discover why they should eat foods in moderation.
Curated OER
Divided We Stand
Learners figure out how to arrange seating in a concert hall given specific requirements. They better explain how dividing can allow us to arrive at mathematical solutions quickly and logically.
Curated OER
Plotting Amish Farmland
Second graders listen to the book, Down Buttermilk Lane by Barbara Mitchell. They discover how to read a grid and then together as a class, plot 2 squares, one yellow and one green. Then they plot the remaining squares independently and...
Curated OER
Sweet or Sour, Like or Different
Students watch a video on comparisons and discuss ways in which objects can be sorted. They play an identification game with a lemon and discuss identification characteristics.
Curated OER
PowerPoint Probability
Sixth graders investigate film making by creating a video about probability. In this math visualization lesson, 6th graders create a presentation for their class demonstrating the probability of random events taking place in the real...
Microsoft
Microsoft Education Lesson Plan: Candy Is Dandy
Explore color distribution of M&M candies using this detailed lesson plan. An engaging integrated lesson that requires understanding of spreadsheets and formulas, and logical reasoning. Links to related websites.
Texas Instruments
Texas Instruments: Gemini Candy
In this activity, students work in groups to collect data and draw conclusions from random samples simulated by drawing tiles from a bag. They represent the data collected in the form of a triple bar graph.
Texas Instruments
Texas Instruments: Numb3 Rs: Candy Land
Based off of the hit television show NUMB3RS, this lesson introduces students to the chi-squared statistical analysis. Although not completely in depth, the lesson does expose students to degrees of freedom, a simple chi-squared formula,...
Science Education Resource Center at Carleton College
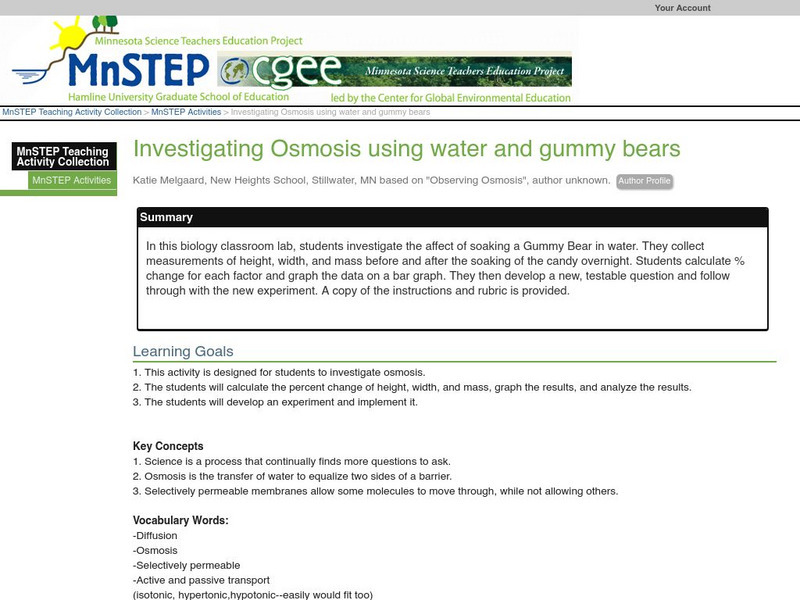
Serc: Investigating Osmosis Using Water and Gummy Bears
For this biology classroom lab, students investigate the affect of soaking a Gummy Bear in water. They collect measurements of height, width, and mass before and after the soaking of the candy overnight. Students calculate % change for...


