Curated OER
Riding on a Pendulum
A comprehensive resource gets fourth grade physical scientists making observations about the period of a pendulum and then applying knowledge to a playground swing. Through seven different stations, they will record observations and...
Virginia Department of Education
The Particle Theory of Matter
Demonstrate the particle theory of matter to high school scientists with an engaging experiment that allows them to visually see the results as substances change from one state to another. The class concludes with a discussion about how...
Community Resources for Science
A Whole New World of DNA and Proteins
Lead your young scientists into an exciting world as they participate in a role play and experiment focused on proteins and DNA. After researching the Central Dogma of Biology, individuals or groups participate in a classroom slide...
EngageNY
Markup and Markdown Problems
There is a 100 percent chance this resource will help pupils connect percents to financial literacy. Young mathematicians use their knowledge of percents to find markups and markdowns in financial situations in the seventh segment in a...
Curated OER
Managing Your Money
Students use the internet to gather information on saving money. They describe the history of money and the responsibilities of the United States Mint. They list their own personal goals and keep a journal as they operate a lemonade...
Curated OER
Timed Multiplication Test Graphs
Students use the tools of data analysis for managing information. They solve problems by generating, collecting, organizing, displaying histograms on bar graphs, circle graphs, line graphs, pictographs and charts. Students determine...
Curated OER
Wings and Othe Things
Learners work in groups that are engaged in different activities at different times. They watch the video "Madagascar" and collect data pertaining to the Fish Eagle's arm spam. They work together to perform mathematical computations...
Curated OER
Database Lesson
Students access the Internet to locate data regarding their assigned mathematician. They organize their notes onto a data form, then enter it into a database, and sort the database according to given criteria.
Curated OER
No Title
Sixth graders, after reviewing and studying the basics of recording, analyzing and presenting data, create on graph paper a bar or line graph to represent given data and then interpret the data. They answer questions about the given data...
Curated OER
Distribution of children living at home
Students examine census data to evaluate the number of students of certain ages living at home. This data is then used to determine the need for day care, or other social programs. They use this information to explore social policies.
Curated OER
Teaching about Diel Temperature Variation
Learners explore temperature variation in lakes and deal with the data.
Curated OER
How is Your Driver Doing?
Sixth graders explore the concept of averaging of numbers and the function of a spreadsheet. Data is collected, analyzed, and displayed in this lesson. The NASCAR race results provides the basis for the collection of data.
Curated OER
Team Players
Students examine a school to career website. They collect and collate data about careers from their own data collection. They determine which skills and abilities ensure successful teamwork. They research two careers that they come...
Curated OER
Merge Letter
Students practice creating a database of addresses and a form letter and eventually merge that information into a letter. They create a from letter that incorporates the data sheet information in response to customers complaints...
Curated OER
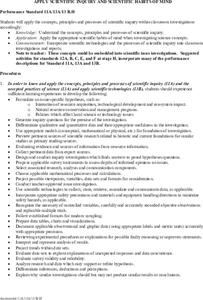
Apply Scientific Inquiry and Scientific Habits of Mind
Students review the components of the scientific inquiry method. In groups, they develop hypothesis on the issue given to them by their teacher and inquiry questions. They state the data in terms of qualitative and quantitative data. ...
Curated OER
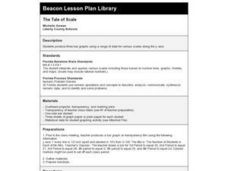
The Tale of Scale
Eighth graders, using a range of data, produce three bar graphs for various scales along the y-axis.
Curated OER
Skittles Candy Count
Students study how to use formulas, edit the spreadsheet, and create and edit charts. They add data to a spreadsheet, format it, add a chart and format it. They count the number of each color of Skittles and record it onto their Candy...
Curated OER
Exploring the Maryland State Archives Website
Student demonstrates the ability to organize, manage and comprehend information and applies appropriate skills to collect organize, and interpret data, They then explore an appreciation of media a sources of information and recreation.
Curated OER
Where Do Green Plants Get Energy?
Fourth graders realize that plants need light, water, and carbon dioxide to carry out photosynthesis. They participate in groups of 4 to plant (with materials provided) a test group of beans to compare to the control group, write a...
Curated OER
Raising the Bar While Hogging the Ham (Radio That Is)
Young scholars create a bar graph that communicates an amount without the need to know the exact data, determine what scale to use to best represent the data and use their bar graph to persuade others.
Curated OER
Water Quality Monitoring of Natural Water
Students set up their own monitoring system. They collect samples from an appropriate sampling site. They analyze data and determine the water quality. They present their information to the class and draw a conclusion.
Curated OER
Plant Biotechnology: Controlling Tissue Differentation
Students demonstrate skills of biotechnology stringent aseptic technique and statistical analysis. They describe hormonal control of plant tissue differentiation and relate this to gene expression. Students observe the effects of...
Curated OER
What is the Problem of Boston Harbor?
Pupils recognize the affects of technology on the environment. They examine data to determine methods to improve waater quality. A research paper is written to desribe recommendations for improving water in the future.
Curated OER
Which Wrap Is Wrapped Right?
Young scholars investigate the integrity and strength of different types of food wraps. They test the wraps and create a graphic organizer for the data. Once it is organized then a lab report can be written. The lesson plan contains...
Other popular searches
- Measurement Data Management
- Data Management Story
- Math and Data Management
- Math Lesson Data Management
- Data Management and Graphing
- Data Management Computing
- Data Management Analysis
- Data Management Math
- Data Management Lesson Plan
- Data Management Math Lessons
- Data Base Management Systems
- Business Data Management


