Curated OER
To Fish or Not to Fish?
Students demonstrate the decision-making process for marine reserves designations. In this role-playing lesson students analyze maps and data relating to a proposed reserve. They formulate the best decisions based on overall issues.
Curated OER
The Disappearing Kelp Forest
Learners observe the effect "El Nino" left on kelp plants and sea urchins. They analyze the data collected by researchers, by graphing it on a TI calculator. Before graphing and analyzing the data, you may want to revisit the events of...
Curated OER
Health of Aquatic Life a Real Problem
Learners explore the health of aquatic life in this science lesson They measure and track the oxygen level in the water to determine the health of the aquatic life. They collect this data using the TI explorer to graph and analyze their...
Curated OER
Curve Fitting
Pupils investigate linear, quadratic, and exponential regressions. They plot sets of data points, determine the regression equation that best fits the data and lastly investigate the coefficient of determination.
Curated OER
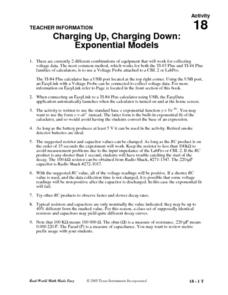
Charging Up, Charging Down
Learners collect and analyze voltage data. Then, they investigate exponential functions using the TI and a Voltage Probe and graph their data and analyze it using a table.
Curated OER
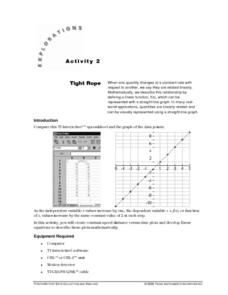
Tight Rope
Learn how to explore the concept of linear functions. In this linear functions lesson, students collect linear data from a motion detector. Students walk to create a linear function. Students plot the points on a graph and determine a...
Curated OER
Stamps and Cemeteries as Storytellers
Students discern the difference between commemorative and regular issue stamps while drawing conclusions about the time period. In this Stamps as Storytellers lesson, students design stamps using symbolism and historical data. In...
Curated OER
Shake, Rattle and Roll
Sixth graders explore the causes and effects of earthquakes. They also collect and analyze data in graphs. They also use the Internet to research earthquakes
Curated OER
Ecology of the Dump
Students determine which types of garbage are biodegradable and which are nonbiodegradable. They practice measuring skills, hypothesizing, taking data, and writing a lab report. Students observe the relative biodegradability of metal,...
Curated OER
Native Species Restoration and its Impact on Local Populations
In this native species restoration worksheet, students are given 3 scenarios to choose from to help restore a declining population of an endangered species of deer. Students make predictions about what they will think happen when the...
Curated OER
Energy Content of Foods
Learners collect data, organize and analyze the data and compare it to real life scenarios. This assignment requires two class periods.
Curated OER
Let the River Run
Pupils examine deposits found in a river in this science lesson plan. They collect data of sediment deposit found in the Mississippi river, then graph and analyze their data using the TI.
Curated OER
TI Workshop Presentation Guide for "Preparing for Proofs"
Pupils discover proofs using the TI in this geometry lesson. They collect data from newspaper and magazines and analyze their data using the TI, relating it to proofs.
Texas Instruments
Can You Breathe Like a Pinniped?
Young learners compare the breathing patterns of different animals in this pinniped lesson. They examine the breathing pattern of California sea lions and northern elephant seals. Pupils collect, compare and analyze data concerning...
Curated OER
FCAT Real World Solving Linear Equations/Systems
Pupils relate real life situation to the equations, graphs and inequalities. They model real life scenarios using matrices and draw conclusions from their data. This lesson plan is aligned with FCAT.
Curated OER
Chill Out: How Hot Objects Cool
Teach how to explore exponential equations. In this Algebra II lesson, learners investigate the graph that occurs as a hot liquid cools. Students model the data algebraically.
Texas Instruments
Math TODAY for TI-Navigator System - Is Leisure Time Really Shrinking?
High schoolers organize data from the USA TODAY Snapshot, "Is leisure time really shrinking?" into two scatter plots and determine the quadratic model for each scatter plot. They determine if these graphs intersect and learn the concept...
Curated OER
Wolves
Students explore wolves. In this ecology and wolves lesson, students research predator-prey relationships on the Internet and complete a related worksheet with a partner. Students interpret data on bar graphs to determine growth and...
Curated OER
West Nile Virus and Lyme Disease: Making Sense of the Numbers
In an interdisciplinary exploration, trace the development of West Nile fever and Lyme diseases. Pupils discover how these diseases are contracted. They collect statistical data and analyze trends.
Curated OER
Involving Community Members, Parents, and Community Agencies in Student Learning
Students predict and estimate the number of moose shot by people between the years of 1986-1990. They analyze data and statistics, construct bar graphs, and conduct research on the Alaskan moose.
Curated OER
Math Today - World Population Milestones
Students use the data from USA TODAY Snapshot "World population milestones" to explore and explain the trends in the world population.
Cornell University
Fibers, Dyes, and the Environment
Nanofibers can be made through electrospinning or force spinning in order to reduce the negative impact on the environment. Pupils study the role of fibers and dye on the environment through a series of five hands-on activities. Then,...
Curated OER
Haber's Process- A Computer Simulation
Learners use an on line simulation to produce ammonia using Haber's process. In this Haber's process lesson plan, students use a spreadsheet to manipulate the pressure, temperature and catalysts used in the production of ammonia. Their...
PwC Financial Literacy
Planning and Money Management: Spending and Saving
Financial literacy is such an important, and often-overlooked, skill to teach our young people. Here is a terrific lesson which has pupils explore how to come up with a personal budget. They consider income, saving, taxes, and their...
Other popular searches
- Measurement Data Management
- Data Management Story
- Math and Data Management
- Math Lesson Data Management
- Data Management and Graphing
- Data Management Computing
- Data Management Analysis
- Data Management Math
- Data Management Lesson Plan
- Data Management Math Lessons
- Data Base Management Systems
- Business Data Management


