Curated OER
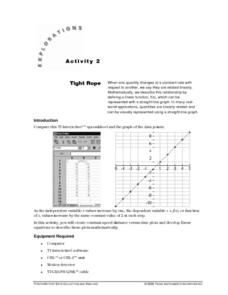
Tight Rope
Learn how to explore the concept of linear functions. In this linear functions lesson, students collect linear data from a motion detector. Students walk to create a linear function. Students plot the points on a graph and determine a...
Curated OER
Stamps and Cemeteries as Storytellers
Students discern the difference between commemorative and regular issue stamps while drawing conclusions about the time period. In this Stamps as Storytellers lesson, students design stamps using symbolism and historical data. In...
Curated OER
Multiply Whole Numbers and Decimals
In this decimals activity, students analyze the data on a table and then read and solve 6 problems. Students read the story problems and multiply a decimal number by a whole number to solve.
Curated OER
Keeping Watch on Coral Reefs
Students investigate the dangers Coral Reefs face by investigating satellite images. In this environmental protection activity, students utilize the Internet to discover the types of satellites and sensors used to provide oceanographic...
Curated OER
Shake, Rattle and Roll
Sixth graders explore the causes and effects of earthquakes. They also collect and analyze data in graphs. They also use the Internet to research earthquakes
Curated OER
Ecology of the Dump
Students determine which types of garbage are biodegradable and which are nonbiodegradable. They practice measuring skills, hypothesizing, taking data, and writing a lab report. Students observe the relative biodegradability of metal,...
Curated OER
Native Species Restoration and its Impact on Local Populations
In this native species restoration worksheet, students are given 3 scenarios to choose from to help restore a declining population of an endangered species of deer. Students make predictions about what they will think happen when the...
Curated OER
Energy Content of Foods
Learners collect data, organize and analyze the data and compare it to real life scenarios. This assignment requires two class periods.
Curated OER
Let the River Run
Pupils examine deposits found in a river in this science lesson plan. They collect data of sediment deposit found in the Mississippi river, then graph and analyze their data using the TI.
Curated OER
TI Workshop Presentation Guide for "Preparing for Proofs"
Pupils discover proofs using the TI in this geometry lesson. They collect data from newspaper and magazines and analyze their data using the TI, relating it to proofs.
Texas Instruments
Can You Breathe Like a Pinniped?
Young learners compare the breathing patterns of different animals in this pinniped lesson. They examine the breathing pattern of California sea lions and northern elephant seals. Pupils collect, compare and analyze data concerning...
Curated OER
FCAT Real World Solving Linear Equations/Systems
Pupils relate real life situation to the equations, graphs and inequalities. They model real life scenarios using matrices and draw conclusions from their data. This lesson plan is aligned with FCAT.
Curated OER
Chill Out: How Hot Objects Cool
Teach how to explore exponential equations. In this Algebra II lesson, learners investigate the graph that occurs as a hot liquid cools. Students model the data algebraically.
Texas Instruments
Math TODAY for TI-Navigator System - Is Leisure Time Really Shrinking?
High schoolers organize data from the USA TODAY Snapshot, "Is leisure time really shrinking?" into two scatter plots and determine the quadratic model for each scatter plot. They determine if these graphs intersect and learn the concept...
Curated OER
The International Space Station-Follow that Graph!
In this altitude change of the International Space Station learning exercise, students observe a graph of the change in altitude of the space station over time due to the Earth's drag. Students solve 3 problems using the data in the graph.
Curated OER
Wolves
Students explore wolves. In this ecology and wolves lesson, students research predator-prey relationships on the Internet and complete a related worksheet with a partner. Students interpret data on bar graphs to determine growth and...
Curated OER
West Nile Virus and Lyme Disease: Making Sense of the Numbers
In an interdisciplinary exploration, trace the development of West Nile fever and Lyme diseases. Pupils discover how these diseases are contracted. They collect statistical data and analyze trends.
Curated OER
Involving Community Members, Parents, and Community Agencies in Student Learning
Students predict and estimate the number of moose shot by people between the years of 1986-1990. They analyze data and statistics, construct bar graphs, and conduct research on the Alaskan moose.
Curated OER
Graphing and Analysis of Water Quality Reports
Students practice making graphs and interpreting them. They compare and contrast different sets of data. They use Microsoft Excel to create different types of graphs.
Curated OER
Manage Soil
Students identify and classify soil ypes according to data on the soil triangle. Given examples, students identify soil conservation practices, using criterion assessment instrument. When giving a case situation involving soil...
Curated OER
Get Connected With Ohm's Law
Students engage in a study of Ohm's Law and conduct research into how the law functions in relationship to the functions for light bulbs. They conduct hands on activities and use digital multi-meters to collect data and plot it for...
Curated OER
Math Today - World Population Milestones
Students use the data from USA TODAY Snapshot "World population milestones" to explore and explain the trends in the world population.
Artisan Global
QuakeFeed Earthquake Map, Alerts and News
Amateur seismologists explore Earth's earthquakes in real time using a variety of map styles and parameter selections.
Cornell University
Fibers, Dyes, and the Environment
Nanofibers can be made through electrospinning or force spinning in order to reduce the negative impact on the environment. Pupils study the role of fibers and dye on the environment through a series of five hands-on activities. Then,...
Other popular searches
- Data Management
- Measurement Data Management
- Data Management Story
- Math and Data Management
- Math Lesson Data Management
- Data Management and Graphing
- Data Management Computing
- Data Management Math
- Data Management Lesson Plan
- Managing Data
- Data Management Math Lessons
- Data Based Management


