Curated OER
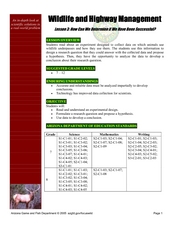
Wildlife and Highway Management
Students create a research questions about animal underpasses and how animals use them. In this animals lesson plan, students use their collected data to answer their question.
Virginia Department of Education
Analyzing and Interpreting Statistics
Use measures of variance to compare and analyze data sets. Pupils match histograms of data sets to their respective statistical measures. They then use calculated statistics to further analyze groups of data and use the results to make...
Curated OER
Who Has the Data? Monitoring Coral Reefs
Young scholars access data to characterize coral reefs. In this scientific research lesson plan, students access data and explain the need for such data when monitoring coral reefs. They will identify and explain three major threats to...
University of Minnesota
Makes Me Sweat
Never let them see you sweat ... unless you can't help it! Scholars design an experiment to determine the effects of stress on the body. They monitor sweat production under different conditions and relate the response to the function of...
Curated OER
The Hope to Cope: Coping Skills
Explore how to weigh the value of positive and negative coping skills in life situations with middle schoolers. They will be able to recognize the coping skills that they have used that been negative ways of coping with stress and look...
Curated OER
Statistical Analysis
In this statistics instructional activity, students analyze the data provided in order to determine the null hypothesis, an alternate hypothesis, and the significant difference between the groups. The one page instructional activity...
PBL Pathways
Maximizing Movie Revenue
Can theaters increase profits by raising or lowering ticket prices? Using data from the National Association of Theater Owners, classes consider this question. The project-based learning activity includes both a profit and revenue...
Teach Engineering
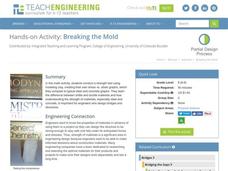
Breaking the Mold
A little too much strain could cause a lot of stress. Groups conduct a strength test on clay. Using books as weights, pupils measure the compression of clay columns and calculate the associated strain and stress. Teams record their data...
EngageNY
Using Matrix Operations for Encryption
Data encryption is an important security measure for sensitive data stored on computers. Pupils learn how to utilize matrices for creating code. They also get a great review of matrix multiplication, inverse matrices, and the identity...
NASA
Rocket Wind Tunnel
Using a teacher-built wind tunnel constructed from a paper concrete tube form, a fan, and a balance, individuals determine the amount of drag their rocket design will experience in flight. Pupils make modifications to increase the...
NASA
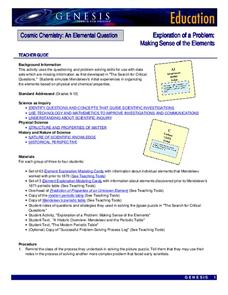
Exploration of a Problem: Making Sense of the Elements
When given too much data to simply memorize, it helps to sort it into manageable groups. The second lesson in the six-part series of Cosmic Chemistry challenges groups of pupils to take a large amount of data and figure out how to best...
Nuffield Foundation
Assessing Skin Sensitivity—Touch Discrimination
How do we distinguish between the number of things touching our skin? Scholars explore an interesting lesson through an experiment. They learn that there must be an unstimulated sensory unit between two touches to distinguish them. They...
Curated OER
Managing Wildlife
Students discuss the current conditions of wildlife in New England. Students explore how animals are tracked and how their population is managed.
Virginia Department of Education
The Germ Theory and Koch’s Postulates
Explore the history of cholera and its effect on society with your biology class. Young biologists will then proceed to grow their own germs, prepared from live cultures, and follow the steps of the scientific method to generate data....
Curated OER
Novel Character Study
Students complete a character study using a database to compile information from a novel. They design a five slide presentation highlighting the character's reaction to different situations in the book. They write an acrostic poem using...
Curated OER
The Trash We Pass
Where does our garbage go? What is the difference between a recyclable and non-recyclable item? Pose these important, but often overlooked, questions to your class and invite them to consider the lasting and damaging effects of the...
Curated OER
Which Coin?
Manage your money with change purses and piggy banks. Once they match different coins to corresponding price tags, first and second graders add the amounts of change in each illustration. For extra practice, bring in small items for kids...
Curated OER
The Effect of Math Anxiety on Cardiovascular Homeostasis
Students examine the effect stress due to test anxiety may have on the heart. As part of the experiment, students hypothesize, collect data, graph data, analyze data and formulate an understanding of their personal level of stress and...
Curated OER
Excel Turns Data Into Information
Learners use excel to analyze data. In this technology lesson, students enter data into the excel program to find averages and organize data.
Curated OER
The Perfect Principal
Students demonstrate their understanding of math skills. In this data analysis lesson, students complete a worksheet requiring them to calculate mean, median, and mode, and create and interpret graphs. Lesson is intended as an assessment...
Curated OER
Lessons for Atlatl Users with Some Experience-Grade 5
Fifth graders throw darts, collecting data for distance traveled. For this data analysis lesson, 5th graders throw a dart using an atlatl. They calculate the speed for each throw and determine the best dart length for distance throws.
Curated OER
Our Favourite Halloween Treat
Students conduct a survey about Halloween candy and create a bar graph illustrating the data. For this data analysis lesson, stud nets are introduced to the topic with a discussion and survey, then the class creates a large graph and...
Curated OER
Atlatl Lessons Grades 4-12: Lesson for Beginning Users of Atlatl
Sixth graders determine the mean, range median and mode of a set of numbers and display them. In this data activity students form a set of data and use computer spreadsheet to display the information. They extend of the process by...
Curated OER
Energy Efficient Homes
Students observe and gather data from a model simulated home. In this efficiency lesson students examine the factors that influence energy efficiency, complete a lab activity then draw conclusions from their data.
Other popular searches
- Data Management
- Measurement Data Management
- Data Management Story
- Math and Data Management
- Math Lesson Data Management
- Data Management and Graphing
- Data Management Computing
- Data Management Math
- Data Management Lesson Plan
- Managing Data
- Data Management Math Lessons
- Data Based Management


