Curated OER
Lessons for Atlatl Users with Some Experience-Grade 5
Fifth graders throw darts, collecting data for distance traveled. For this data analysis lesson, 5th graders throw a dart using an atlatl. They calculate the speed for each throw and determine the best dart length for distance throws.
Curated OER
Our Favourite Halloween Treat
Students conduct a survey about Halloween candy and create a bar graph illustrating the data. For this data analysis lesson, stud nets are introduced to the topic with a discussion and survey, then the class creates a large graph and...
Curated OER
Atlatl Lessons Grades 4-12: Lesson for Beginning Users of Atlatl
Sixth graders determine the mean, range median and mode of a set of numbers and display them. In this data activity students form a set of data and use computer spreadsheet to display the information. They extend of the process by...
Curated OER
Energy Efficient Homes
Students observe and gather data from a model simulated home. In this efficiency lesson students examine the factors that influence energy efficiency, complete a lab activity then draw conclusions from their data.
Curated OER
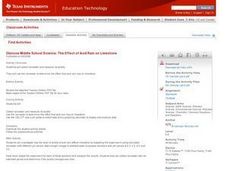
The Effect of Acid Rain on Limestone
Pupils investigate the pH of rain water in this earth science lesson. They collect rain water from their area and explore the pH when lime stone is added, then they will use the data collected to conjecture as to the effect of acid rain...
Texas Instruments
Light and Day
Pupils explore the concept of collecting data as they collect data on their graphing calculator about time, temperature, and light. Learners plot the data and create histograms and box and whisker plots to analyze the data.
National Wildlife Federation
Ghost Town
Around 93 percent of the reefs on Australia's Great Barrier Reef have been bleached, and almost one quarter of them are now dead. Scholars research the sea temperatures, especially around the areas with coral reefs, to make connections...
Curated OER
Time Management
Students are taken through the design process to develop a system of time management for themselves and others. They practice participating in a critique of other students' time schedules and modify and improve their initial time...
Baylor College
HIV/AIDS in the United States
In the final of five lessons about HIV/AIDS, groups create presentations to share data about the infection rates in the United States, examining demographic and geographic trends over the past ten years. Depending on how much time you...
Curated OER
The Race of Baseball All-Stars
Collect and analyze data. Pupils graph their data and model with it to solve real life problems. They use logic and deductive reasoning to draw conclusions.
Curated OER
How Texas is Planning To Manage Its Water
Students research water management strategies in Texas. They analyze projected demand for water in the year 2050, interpret graphs and tables and then discuss the data as part of a written report. They research and map the locations of...
Curated OER
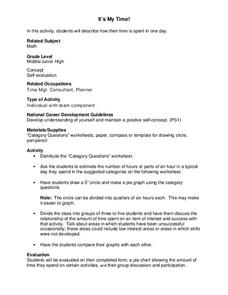
It's My Time!
Students create a pie chart. In this time lesson, students determine the amount of time they spend on given activities. They create a pie chart diagraming the data. Students share their graphs with the class.
Discovery Education
Mood Music!
Grouchy? Sad? Here's a great resource that shows kids how music can be used to lift their spirits. Kids collect and chart data on the effects of music on emotions. After analyzing the results of their experiment, they develop their own...
Discovery Education
Sonar & Echolocation
A well-designed, comprehensive, and attractive slide show supports direct instruction on how sonar and echolocation work. Contained within the slides are links to interactive websites and instructions for using apps on a mobile device to...
Curated OER
How Dense is Salt Water?
Young schoolers explore the concept of linear regression. They determine the mass and density of salt water. Pupils add salt to water and record the density as salinity increases, and perform a linear regression on the data to model the...
Curated OER
Destressing: Don't Sweat the Small Stuff
Students interview peers, teachers, counselors, parents and local health providers to see how they identify "good" stress and suggest teens cope, write news feature about stress, complete with extra boxes, such as list of signs to spots,...
Curated OER
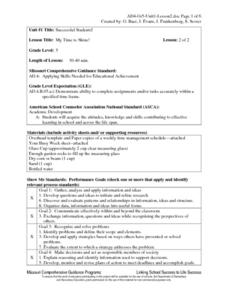
My time to Shine!
Fifth graders identify and acquire the attitudes, knowledge, and skills that contribute to effective learning in school and across the life span. Then they identify and practice through an experiment, time management skills and why it is...
Curated OER
Using SWMP Data
Students are introduced to the SWMP system which tracks short-and long-term changes in water. Using this data, they plot and interpret the data on a graph to determine how human activities are lowering the water quality. They also...
Curated OER
Time Management
Students plot activities for a 24 hour day. They record their information on a spread sheet program. Students list categories they use and write equations for cells that add cells of each category together. Students create a pie chart of...
Curated OER
Slash Trash! Reducing, Reusing and Recycling Our Way to Zero Waste
The other "Three Rs" are covered in this lesson: reduce, reuse, and recycle. Over four weeks, conservationists collect data about waste in their own homes. They combine their findings with those of other students in order to analyze...
PricewaterhouseCoopers
Risk Management and Insurance: Insurance Costs and Considerations
Compare the different types of insurance with high schoolers, and have them learn the benefits and costs of medical, auto, and home policies. The resource addresses what makes some insurances more costly and what teenagers can do to find...
Curated OER
Mapping Data Made Manageable
Students explore how to select unbiased random samples as they choose report data to include on maps. They propose methods for choosing random numbers and discuss their advantages and disadvantages. They consider bias in science.
Curated OER
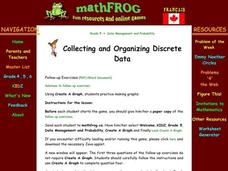
Collecting and Organizing Data
Fifth graders explore methods of generating and organizing data. Afterward, they visit a specified website where they analyze data, organize, and create graphs. Students follow instructions and complete answers to questions. They...
Curated OER
Scientific Approach to Forest Management
Students use wireless laptop computers to collect, store, communicate, and organize data from the 1999 Jasper Fire area. They collect data in the field and compare it to student-collected data from prior years to develop conclusions...
Other popular searches
- Data Management
- Measurement Data Management
- Data Management Story
- Math and Data Management
- Math Lesson Data Management
- Data Management and Graphing
- Data Management Computing
- Data Management Math
- Data Management Lesson Plan
- Managing Data
- Data Management Math Lessons
- Data Based Management


