Kenan Fellows
Lego Thinking and Building
Run a simulated airplane manufacturing plant with your pupils as the builders! Learners build Lego airplane models and collect data on the rate of production, comparing the number produced to the number defective. Using linear...
Curated OER
Ice Cream
Students explore the concepts of mean, median, mode, and range as they elicit data about people's favorite flavor of ice cream. A practical application of the data obtained offers an extension to the lesson plan.
Curated OER
Nutrition and Food Security
Examine the three basic nutrients and their effects on the body. Fifth graders will research data to construct a bar graph and then demonstrate the relationship between malnutrition and food security. This is a very comprehensive...
NOAA
Marine Policy
Save the oceans! The 22nd installment of a 23-part NOAA Enrichment in Marine sciences and Oceanography (NEMO) program focuses on laws and marine policy. Pupils take part in an activity investigating fisheries stock data.
National Wildlife Federation
Lights, Camera, Action! Conducting an Energy Audit
Thirty percent of energy used by schools is used inefficiently! Part two in the series of 12 has groups perform energy audits of their schools as part of the Cool Schools Challenge. Each group is assigned a specific room, performs the...
Curated OER
Bird Airport Control
Young scholars visit a local wetland and record observations of waterfowl on downloadable worksheets. They compile class data and list similarities and differences among species of birds observed.
Curated OER
Discovering Pi
Define terminology related to a circle. Practice accuracy in measuring and then create a spreadsheet based on data collected from solving for parts of a circle. Groups can have fun analyzing their data as it relates to Pi.
Code.org
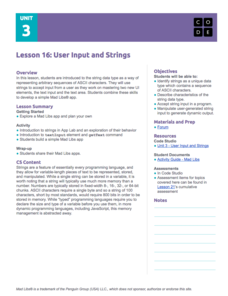
User Input and Strings
Pupils learn to apply strings in computer science. They master two new user interface elements and also use string type data to represent ASCII characters. Finally, individuals create an app for Mad Libs in the eighth lesson of the series.
Curated OER
Yummy Math
Young mathematicians use bags of Skittles to help them gain practice in graphing and organizing data. They work in pairs, and after they have counted and organized their Skittles, they access a computer program which allows them to print...
Curated OER
Sustainable Marine Fisheries
Through a fishing simulation, environmentalists discover consequences of over fishing. Afterward, they discuss how the activity relates to the impact of real-life commercial fishing. They also consider sustainability in the fishing...
Curated OER
Super Ticket Sales
Use this graphing data using box and whisker plots lesson to have learners make box and whisker plots about ticket sales of popular movies. They find the mean, median, and mode of the data. Pupils compare ticket sales of the opening...
Curated OER
Boom and Bust
Students investigate commercial fishery. In this fishery lesson, students describe stages in commercial fishery, interpret data and predict when a fisher stock is showing signs of overexploitation.
Curated OER
Nutria And The Disappearing Marsh
Young analysts examine changes in the nutria population, vegetation density, and marsh area over time in the wetlands of Louisiana. They import data and use the TI-73 Explorer to graph and analyze the effects of nutria on marsh loss.
Curated OER
Strawkets and Weight
Students investigate the effect that weight has on rocket flight. They construct a variety of straw-launched rockets that have different weights, observe what happens when the weight of a rocket is altered by reducing its physical size...
Texas Instruments
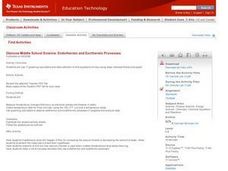
Endothermic and Exothermic Processes
Students investigate temperature using the TI. In this chemistry lesson, students analyze the change in temperature, as chemicals are dissolved in water. They analyze data collected using the CBL 2.
Curated OER
NUMB3RS Activity: Where’s the Source? Episode: “Undercurrents”
Several real-world problems are posed as a way to learn about vector fields in order to make some predictions after analyzing the data. The main problem comes from the tv show NUMB3RS and is based on solving a crime where a body has...
Curated OER
Math: Real Time and Live
Get an interdisciplinary edge. Scholars study air contamination and slope. They record the time it takes for air fresheners to reach them at variable distances. They document their times, classify them by distance, and draw a scatter...
California Academy of Science
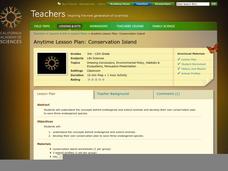
Conservation Island
Why not walk in the footsteps of Teddy Roosevelt and become a conservationist? After discussing issues and reasons for animal extinction, the class creates their own conservation plans. Each small group is given mock data regarding a...
Chicago Botanic Garden
Personal Choices and the Planet
How big is your footprint? Activity three culminates the series by having groups complete carbon footprint audits with people in their schools and/or around the districts. Groups then gather their data, create a presentation including...
Curated OER
Numbers Tell a Story
Learners connect census data to historical events. In this civics lesson plan, students understand cause and effect, and how they are reflected in census data and analyze census data for social and economic significance.
Curated OER
When the Snow is as High as an Elephant
High schoolers study the concept of mean values using a data plot. Learners enter the given data in the activity to create their data table. They use the data table to calculate the mean of the snowfall percentage provided in the...
Curated OER
How to Graph in Excel
Fourth graders construct data graphs on the Microsoft Excel program. In this statistics instructional activity, 4th graders formulate questions and collect data. Students represent their results by using Excel.
Curated OER
The New Haven Oyster Industry and Water Quality
Students examine the different types of water pollutants and how they affect the waterways. In this environmental science lesson, students collect and interpret data from government agencies. They discuss how industrial development in...
Curated OER
Beginning Graphs in MS Excel
Students practice creating graphs in Microsoft Excel. In this technology lesson, students conduct a random survey and collect data. Students use the Microsoft Excel program to create a bar graph of the data.
Other popular searches
- Data Management
- Measurement Data Management
- Data Management Story
- Math and Data Management
- Math Lesson Data Management
- Data Management and Graphing
- Data Management Computing
- Data Management Math
- Data Management Lesson Plan
- Managing Data
- Data Management Math Lessons
- Data Based Management


