Curated OER
Monopoly Graphs
Students relate the concepts of linear functions to the game of monopoly. For this algebra lesson, students solve problems with ratio and proportion. They collect data and graph it.
Curated OER
How Fast Is Your Car?
Eighth graders discover the relationship between speed, distance, and time. They calculate speed and represent their data graphically. They, in groups, design a ramp for their matchbox car. The goal is to see who's ramp produces the...
Curated OER
Straw Breathing Exercise
High schoolers fill out an anonymous questionaire to explore whether they might have asthma. They then set up a spreadsheet to enter the data, decide on a definition of asthma, and figure out the prevalence of asthma. Pupils simulate...
Curated OER
Count The Letters
Students perform activities involving ratios, proportions and percents. Given a newspaper article, groups of students count the number of letters in a given area. They use calculators and data collected to construct a pie chart and bar...
Curated OER
Census and Apportionment
Students manage census data. In this U.S. Census lesson plan, students understand and describe the role census data play in apportionment decisions as they analyze the connection between apportionment and the Electoral College.
Curated OER
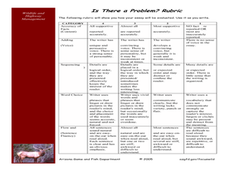
Is There a Problem with Wildlife on our Roads?
Students create a graph and analyze it to see if the data shows there is a problem with wildlife on the roads. In this wildlife collision lesson students write an essay to support their conclusions.
Curated OER
America's Underwater Treasures Viewing Guide
Students complete a worksheet while watching a video about how humans affect the ocean environment. They discover the need for a practice of balancing fisheries and their fishing practices. They examine how scientists use data to help...
Curated OER
Global Warming Statistics
Learners research and collect data regarding temperature changes for a specific location and find the mean, median, and mode for their data. In this climate change lesson plan, students choose a location to research and collect data...
Curated OER
Distribution of children living at home
Students use E-STAT to examine demographics. In this social demographics lesson, students use statistical data to determine if a particular family is in need of assistance. Students will discuss social and educational policies and...
Curated OER
In the Forecast, a Flurry of Concerns about Snow
Students consider the effects of climate change on snowfall and how a lack of data in snowfall collection impair climate change research. They, in groups, investigate different effects of snowfall and make recommendations to lobbyists.
Curated OER
Gravity, Angles, and Measurement
Students relate math to real life scenarios. In this geometry lesson, students launch a ball tracking each launch using a graph. They analyze their data for speed, angles and distance, trying to improve on each launch.
Curated OER
Gravity
Students perform inquiry in response to the question "Do objects fall at the same rate?", teacher candidates discuss a model experiment for secondary students to discover the answer, including recording and analyzing data.
Curated OER
How Do We Solve the Problem of Wildlife on Our Roads?
Students analyze data on elk ecology and movements across the highway. In this ecology lesson, students research ways to save them from highway collisions. They write a report and present their findings in class.
Curated OER
Bioinformatics
Learners conduct a series of scientific investigation using bioinformatics. In this molecular biology lesson plan, students collect experimental data using different educational softwares. They calculate and analyze relationships using...
Curated OER
Measuring Biodiversity
Students collect species data from a mock intertidal community. In this biology lesson, students graph their data and analyze the species in it. They construct a species accumulation curve and present it to class.
Curated OER
Biodiversity and Ecosystems
Middle schoolers differentiate between biotic and abiotic factors in this science lesson plan. Learners collect data for the experiment and analyze the data after graphing it using the CBL 2. This experiment is split into two different...
Curated OER
To Fish or Not to Fish?
Students demonstrate the decision-making process for marine reserves designations. In this role-playing lesson students analyze maps and data relating to a proposed reserve. They formulate the best decisions based on overall issues.
Curated OER
Distribution of Active Volcanoes Exercise
Students collect and plot data, then interpret the results and answer questions about the geologic causes and the human effects of volcanic eruption. They participate in a role-play activity and a virtual field trip, as well.
Curated OER
Siting Wind Power
Students analyze a variety of curves that describe the power extracted from the wind by a variety of commercially produced wind turbines. They utilize site specific topographic maps and political boundary data to evaluate and make...
Curated OER
Environmental Responsibility
Young scholars discuss the importance of recycling and preventing pollution. In groups, they complete mini-studies on various environmental issues and evaluate different consumer products. They use global warming data to determine the...
Curated OER
The Disappearing Kelp Forest
Learners observe the effect "El Nino" left on kelp plants and sea urchins. They analyze the data collected by researchers, by graphing it on a TI calculator. Before graphing and analyzing the data, you may want to revisit the events of...
Curated OER
Health of Aquatic Life a Real Problem
Learners explore the health of aquatic life in this science lesson They measure and track the oxygen level in the water to determine the health of the aquatic life. They collect this data using the TI explorer to graph and analyze their...
Curated OER
Curve Fitting
Pupils investigate linear, quadratic, and exponential regressions. They plot sets of data points, determine the regression equation that best fits the data and lastly investigate the coefficient of determination.
Curated OER
Charging Up, Charging Down
Learners collect and analyze voltage data. Then, they investigate exponential functions using the TI and a Voltage Probe and graph their data and analyze it using a table.
Other popular searches
- Data Management
- Measurement Data Management
- Data Management Story
- Math and Data Management
- Math Lesson Data Management
- Data Management and Graphing
- Data Management Computing
- Data Management Math
- Data Management Lesson Plan
- Managing Data
- Data Management Math Lessons
- Data Based Management


